SSAS Tabular model implementaion with example

Alpesh Patel![]() Solution Architect at TCS (SAFe®Agilist, TOGAF® Foundation, PSM I®, MCP, MCSD)
Solution Architect at TCS (SAFe®Agilist, TOGAF® Foundation, PSM I®, MCP, MCSD)
 Solution Architect at TCS (SAFe®Agilist, TOGAF® Foundation, PSM I®, MCP, MCSD)
CERTIFIED EXPERT
Published:
Browse All Articles > SSAS Tabular model implementaion with example
Most SQL Server administrators know about the Analysis Service as part of SQL Server. There are two ways to create cubes. One is the Dimension model we use most of the time to create cubes. In SQL Server 2012, Microsoft introduced the Tabular model -- a lightweight version of Dimension model. It is like Power Pivot but with some extra features.
These are the benefits of the Tabular model, and an idea of when you can use it.
Benefits:
The architecture of the Tabular model is more lightweight than Multidimensional model. Using the Tabular model you can create a cube directly from an OLTP database; there is no need to create the DW compatible database. One can also create a cube from an OLAP database as well. Moreover, they are easy to create and less expensive in terms of time and money.
The Tabular database design is normalized so data retrieval is faster than a de-normalized database. It uses the same xVelocity engine as the Dimension model so it is faster than Power Pivot.
In Power Pivot you cannot save it and use it later. However, using the Tabular model you can save it on the server and review it like a normal Dimension model cube.
When to use the Tabular model:
There is no requirement of big DW and data size is lesser then one can use Tabular Model.
One more reason is need DW up and running in shorter period.
Budget constrains in organization.
How to create a Cube using the Tabular model:
To work with the Tabular model you have to create new Instance of SSAS using Tabular model. see steps here
Getting Started
![Tabular Creation]()
![Create Connection and Import data]()
![Create Connection and Import data]()
![Create Connection and Import data]()
![Create Measures]()
![Create KPI]() View is in two formats: Tabular and Diagram form. At the bottom right you can find the button to switch the view.
View is in two formats: Tabular and Diagram form. At the bottom right you can find the button to switch the view.
![Hierarchy and Relationship]()
Hope you enjoyed reading.
These are the benefits of the Tabular model, and an idea of when you can use it.
Benefits:
The architecture of the Tabular model is more lightweight than Multidimensional model. Using the Tabular model you can create a cube directly from an OLTP database; there is no need to create the DW compatible database. One can also create a cube from an OLAP database as well. Moreover, they are easy to create and less expensive in terms of time and money.
The Tabular database design is normalized so data retrieval is faster than a de-normalized database. It uses the same xVelocity engine as the Dimension model so it is faster than Power Pivot.
In Power Pivot you cannot save it and use it later. However, using the Tabular model you can save it on the server and review it like a normal Dimension model cube.
When to use the Tabular model:
There is no requirement of big DW and data size is lesser then one can use Tabular Model.
One more reason is need DW up and running in shorter period.
Budget constrains in organization.
How to create a Cube using the Tabular model:
To work with the Tabular model you have to create new Instance of SSAS using Tabular model. see steps here
Getting Started
1.
Open VS 2012 and New project in that you can find new template for Analysis Service Tabular project. It will create project for you with single .bim file.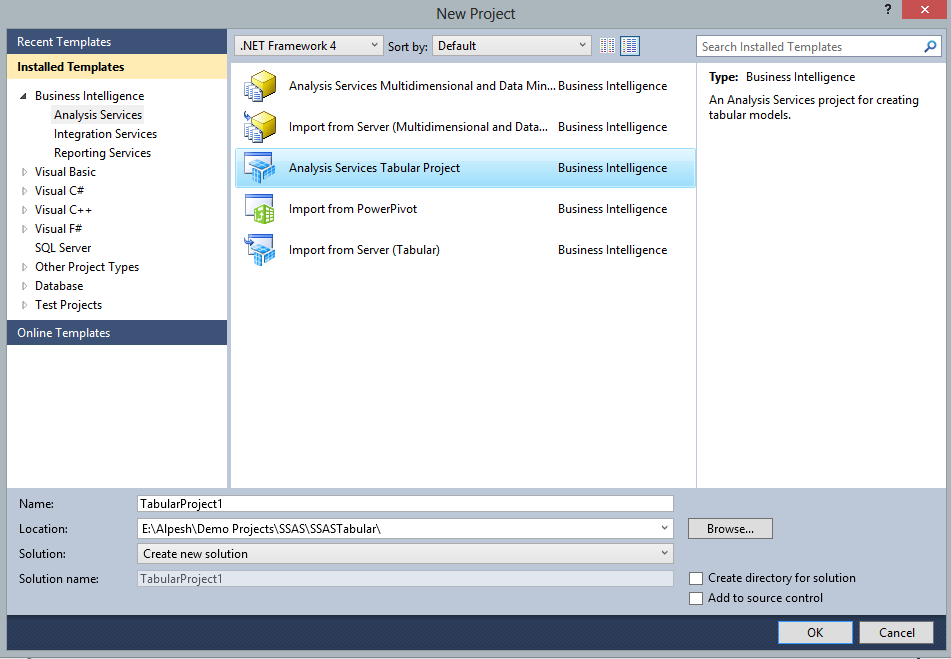
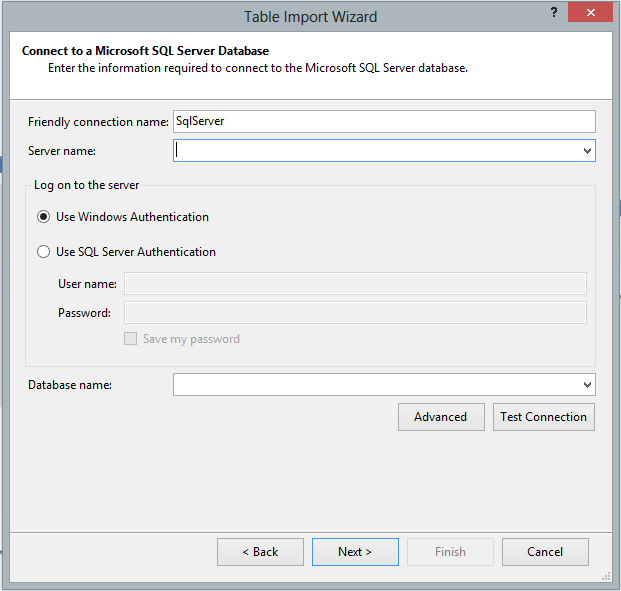
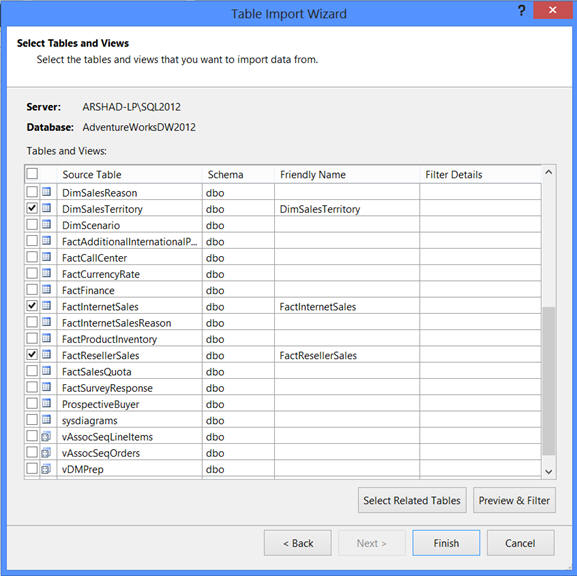
2.
Now create a new connection by hitting the DB icon in the toolbar and follow the friendly steps and import tables those you want in the Cube. After finishing the import step you will get each table in a tabular format on separate sheets like Excel.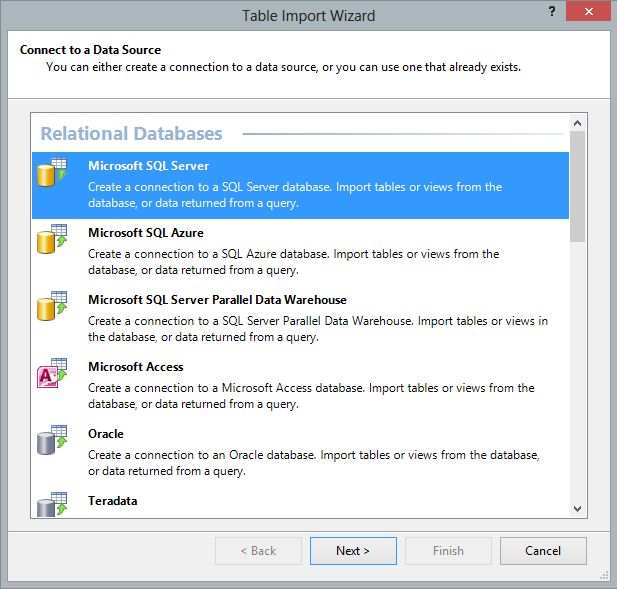
3.
Now you can see the all tables in Table format. Without measure cube is nothing. To create a measure click on field from table and hit the Icon for Sum. You can measure the value for different aggregate functions like Sum , Count, Max, Min and Avg etc. When you create a measure you can see it in below table.
4.
Now create KPI. Select the measures you want to use for KPI and right click. The wizard will show a new context menu you use to Create KPI. Give absolute values or select a measure to create KPI.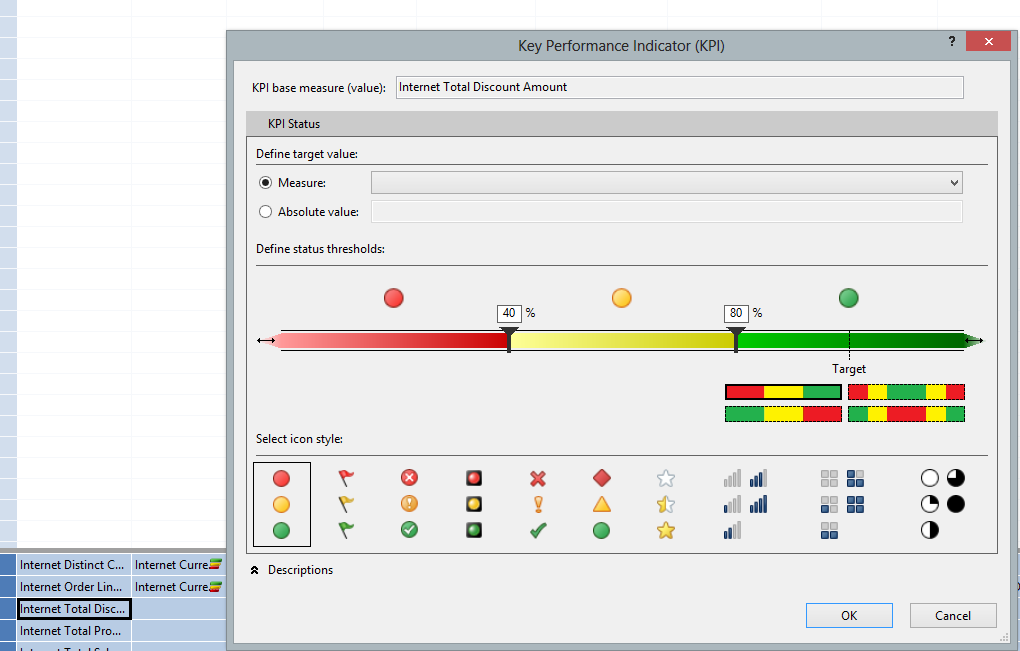 View is in two formats: Tabular and Diagram form. At the bottom right you can find the button to switch the view.
5.
After moving to Diagram mode you will see the tables with their relationships. If there is no relationship between tables you can create it by right clicking on a table and select the menu item as what you want to create.
6.
Now it's time to deploy the Cube. Go to Solution explorer, select the project, right click and select the deploy menu item Deploy Cube. It will be deployed to the SSAS Tabular service.Hope you enjoyed reading.
Have a question about something in this article? You can receive help directly from the article author. Sign up for a free trial to get started.
Comments (0)