

Browse All Articles > Covariance and Correlation in MS Access
by Patrick G. Matthews
Access provides functions for computing several common descriptive aggregate statistics for column data, offering such aggregate functions as Count, Sum, Min, Max, standard deviation and variance (StDev, StDevP, Var, and VarP), and average (Avg). In addition to these typical aggregate functions, Access also offers the so-called "domain aggregate" counterparts for each of the aggregates already mentioned.
In a recent article, I described how to extend that list to include the median, mode, skewness, and kurtosis statistics.
However, none of these statistics tell us anything about how a paired columns of data relate to each. This article addresses that gap by demonstrating how to use Microsoft Access to calculate the covariance and correlation between a pair of columns.
The next two sections will take covariance and correlation in turn, and demonstrate how to perform the computations first using native Jet SQL, and then using the new Visual Basic for Applications (VBA) functions that provide "domain aggregate"-like capabilities for covariance and correlation and are included with this article.
The concluding sections of this article will contain:
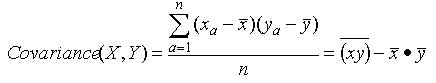
The covariance statistic measures how much two random variables tend to change in tandem.
Covariance is determined as follows:
![Covariance formula]()
In native Jet SQL, you can calculate the covariance of two columns in a single table using aggregate functions. The following expression is adapted from the query "qrySet1_SQL_CorrCov_All" in the sample database:
The SQL statement above computes the covariance using all of the data from columns X and Y in the table Set1. However, there are natural subsets in that data:
To get these subset results, simply modify the query to include the subset columns in the SELECT clause, and to use a GROUP BY clause with those subset columns. The examples below all demonstrate this technique, and are also adapted from several queries available in the sample database:
For users accustomed to writing complex SQL statements in Access, none of those queries are particularly difficult.
Users who prefer to mitigate the risk of making a mistake in the formula may instead want to use the new function DCovariance provided here. Substituting the DCovariance approach, the queries above become a bit simpler, as follows:
The DCovariance function takes the following arguments:
For all four arguments, I strongly recommended that you place the column/table/query names in square brackets. This is mandatory if your database object names violate the usual naming rules, such as by including spaces, punctuation, keywords, etc.
The Source Code section to this article contains the VBA source code for the DCovariance function, and the sample database provided in the [i]Sample Files[/i] section illustrates several use cases each for calculating covariance using SQL and using DCovariance.
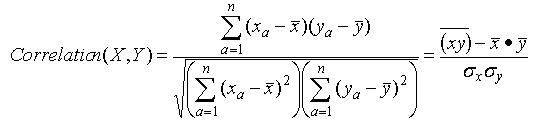
The correlation statistic is another measure of the dependence between two random variables. This article's scope covers the commonly-used, so-called "Pearson correlation", which indicates the linearity of the relationship between the two random variables:
Correlation is calculated as follows:
![Correlation formula]()
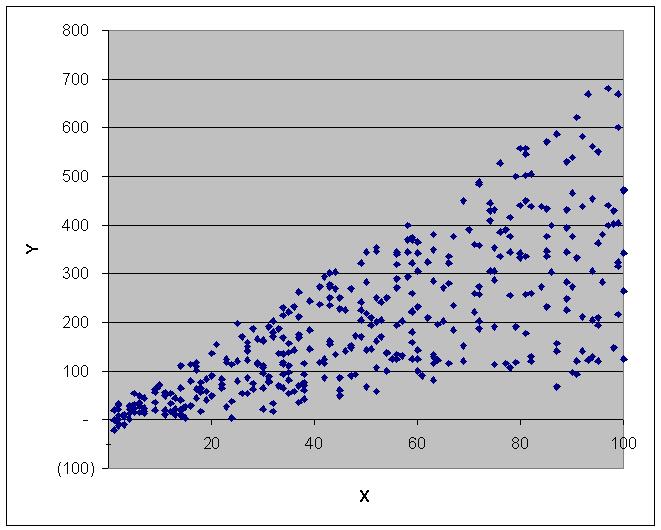
As examples, the scatter plots below depict the data for the two sample sets available in the sample database:
![Set1 Scatter Plot]()
In Set1, X and Y have a correlation of approximately 0.75, indicating a strong, positive linear relationship.
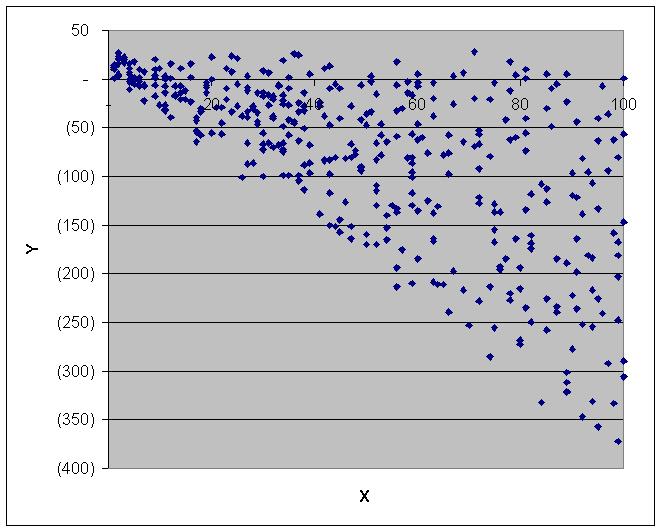
![Set2 Scatter Plot]()
In Set1, X and Y have a correlation of approximately -0.66, indicating a fairly strong, negative linear relationship.
Before proceeding, two notes of caution about correlation:
In native Jet SQL, as with covariance, you can calculate the correlation of two columns in a single table by means of aggregate functions. The following expressions are adapted from various queries in the sample database. As with the examples for covariance, to calculate correlation for subsets of the data, use GROUP BY clauses to define your subsets.
Again, while using such SQL statements is not beyond the means of experienced Access users, the DCorrelation function offers a convenient way to avoid having to remember and write the necessary SQL expressions, thus simplifying the task for less experienced Access users.
Rewriting the queries above to use the DCorrelation function yields the following SQL statements:
The DCorrelation function takes the following arguments:
For all four arguments, I strongly recommended that you place the column/table/query names in square brackets. This is mandatory if your database object names violate the usual naming rules, such as by including spaces, punctuation, keywords, etc.
The Source Code section to this article contains the VBA source code for the DCorrelation function, and the sample database provided in the [i]Sample Files[/i] section illustrates several use cases each for calculating correlation using SQL and using DCorrelation.
Below please find the VBA source code for the DCovariance and DCorrelation functions.
This article includes two sample files:
Access database
Stats-Part-2.mdb
Excel workbook
Stats-Article-Part-2.xls
To implement the DCovariance and/or DCorrelation functions in your Access projects, simply copy the source code listed for the desired functions(s) in this article, and paste the code into a regular VBA module in your Access project.
Once you have added the code to your Access project, you will be able to use the functions you added in queries, forms, reports, and in other VBA procedures in your project.
Notes:
While Access has no native functions for correlation or covariance, Excel has native functions for both. The workbook posted in the Sample Files section demonstrates how to use the CORREL and COVAR functions to compute correlation and covariance, respectively. Please note that, to compute the subset correlations and covariances, I used "array formulas", as the ranges for the two variables were not contiguous.
In addition to Excel, any decent statistical analysis package will calculate correlation and covariance. For my important statistics work I prefer Minitab, but SAS, SPSS, and Mathematica will all perform well.
In addition, FMS, Inc. markets the Total Access Statistics add-in, a comprehensive statistical package that like the statistics packages above goes far beyond simple covariance and correlation. Several Experts here at Experts Exchange recommend that product.
Originally, the SQL examples and the VBA code for this article used correct, but sub-optimal, calculation logic to compute the covariance and correlation statistics. Access Expert and Page Editor harfang pointed this out to me, and he was kind enough to also supply an optimized calculation method. (My original logic used a sub-query to generate averages; the new logic dispenses with the sub-query and makes all the calculations in a single pass.)
=-=-=-=-=-=-=-=-=-=-=-=-=-=-=-=-=-=-=-=-=-=-=-=-=-=-=-=-=-=-=-=-=-=-=-=-=-=-=-=-=
If you liked this article and want to see more from this author, please click here.
If you found this article helpful, please click the Yes button near the:
Was this article helpful?
label that is just below and to the right of this text. Thanks!
=-=-=-=-=-=-=-=-=-=-=-=-=-=-=-=-=-=-=-=-=-=-=-=-=-=-=-=-=-=-=-=-=-=-=-=-=-=-=-=-=
Introduction
Access provides functions for computing several common descriptive aggregate statistics for column data, offering such aggregate functions as Count, Sum, Min, Max, standard deviation and variance (StDev, StDevP, Var, and VarP), and average (Avg). In addition to these typical aggregate functions, Access also offers the so-called "domain aggregate" counterparts for each of the aggregates already mentioned.
In a recent article, I described how to extend that list to include the median, mode, skewness, and kurtosis statistics.
However, none of these statistics tell us anything about how a paired columns of data relate to each. This article addresses that gap by demonstrating how to use Microsoft Access to calculate the covariance and correlation between a pair of columns.
The next two sections will take covariance and correlation in turn, and demonstrate how to perform the computations first using native Jet SQL, and then using the new Visual Basic for Applications (VBA) functions that provide "domain aggregate"-like capabilities for covariance and correlation and are included with this article.
The concluding sections of this article will contain:
The source code for these new user-defined functions
Provide sample files and instructions for implementing the new functions in your Access projects
Suggest additional resources for more rigorous statistical analysis
Covariance
The covariance statistic measures how much two random variables tend to change in tandem.
Two completely independent variables will have a covariance of zero
Two random variables that tend to increase or decrease in tandem will have a positive covariance
Two random variables that tend to increase or decrease inversely (i.e., as one increases the other decreases, and vice versa) will have a negative covariance
Covariance is determined as follows:
In native Jet SQL, you can calculate the covariance of two columns in a single table using aggregate functions. The following expression is adapted from the query "qrySet1_SQL_CorrCov_All" in the sample database:
SELECT Avg(X * Y) - Avg(X) * Avg(Y) AS Covariance
FROM Set1;The SQL statement above computes the covariance using all of the data from columns X and Y in the table Set1. However, there are natural subsets in that data:
There are columns for Code and Section
Thus, we may want to compute the covariances in such subsets as for each Code value, each Section value, or the combination of Code and Section
To get these subset results, simply modify the query to include the subset columns in the SELECT clause, and to use a GROUP BY clause with those subset columns. The examples below all demonstrate this technique, and are also adapted from several queries available in the sample database:
Adapted from "qrySet1_SQL_CorrCov_Code":

                      SELECT Code, Avg(X * Y) - Avg(X) * Avg(Y) AS Covariance
                      FROM Set1
                      GROUP BY Code;

                      Adapted from "qrySet1_SQL_CorrCov_Sect":

                      SELECT Section, Avg(X * Y) - Avg(X) * Avg(Y) AS Covariance
                      FROM Set1
                      GROUP BY Section;

                      Adapted from "qrySet1_SQL_CorrCov_SectCode":

                      SELECT Section, Code, Avg(X * Y) - Avg(X) * Avg(Y) AS Covariance
                      FROM Set1
GROUP BY Section, Code;For users accustomed to writing complex SQL statements in Access, none of those queries are particularly difficult.
Users who prefer to mitigate the risk of making a mistake in the formula may instead want to use the new function DCovariance provided here. Substituting the DCovariance approach, the queries above become a bit simpler, as follows:
Adapted from "qrySet1_UDF_CorrCov_All"

                      SELECT DCovariance("X","Y","Set1") AS Covariance;

                      Adapted from "qrySet1_UDF_CorrCov_Code"

                      SELECT Code, DCovariance("X","Y","Set1","[Code] = '" & [Code] & "'") AS Covariance
                      FROM Set1
                      GROUP BY Code;

                      Adapted from "qrySet1_UDF_CorrCov_Sect"

                      SELECT Section, DCovariance("X","Y","Set1","[Section] = '" & [Section] & "'") AS Covariance
                      FROM Set1
                      GROUP BY Section;

                      Adapted from "qrySet1_UDF_CorrCov_SectCode"

                      SELECT Section, Code, DCovariance("X","Y","Set1","[Section] = '" & Section & "' And [Code] = '" & Code & "'") AS Covariance
                      FROM Set1
GROUP BY Section, Code;The DCovariance function takes the following arguments:
X_Column is the name of the column containing the data for the first random variable
Y_Column is the name of the column containing the data for the second random variable
Tbl is the name of the table or query containing your data
Criteria is an optional argument containing any criteria used to select subsets of your data. Be sure to use single quotes to qualify text values and # to qualify dates in the Criteria string
For all four arguments, I strongly recommended that you place the column/table/query names in square brackets. This is mandatory if your database object names violate the usual naming rules, such as by including spaces, punctuation, keywords, etc.
The Source Code section to this article contains the VBA source code for the DCovariance function, and the sample database provided in the [i]Sample Files[/i] section illustrates several use cases each for calculating covariance using SQL and using DCovariance.
Correlation
The correlation statistic is another measure of the dependence between two random variables. This article's scope covers the commonly-used, so-called "Pearson correlation", which indicates the linearity of the relationship between the two random variables:
The Pearson correlation has a minimum value of -1 and a maximum value of 1
The absolute value indicates the goodness-to-fit for a linear model relating the two variables: an absolute value of 1 indicates a perfect linear relationship (no observed residuals)
A positive value indicates that the two variables tend to rise or fall in value in tandem
A negative value indicates an inverse relationship: as one variable rises, the other tends to fall, and vice versa
A correlation of zero indicates that there is no apparent relationship, and that the two variables are independent
Correlation is calculated as follows:
As examples, the scatter plots below depict the data for the two sample sets available in the sample database:
In Set1, X and Y have a correlation of approximately 0.75, indicating a strong, positive linear relationship.
In Set1, X and Y have a correlation of approximately -0.66, indicating a fairly strong, negative linear relationship.
Before proceeding, two notes of caution about correlation:
One of the enduring truisms of statistical analysis is that "correlation does not imply causation". Even if X and Y are highly correlated, it does not follow that X necessarily causes Y, or vice versa
Particularly over small data sets or over a compressed range, two variables may appear to have a strong Pearson correlation, and yet the data may not have a truly linear relationship. A dramatic example of this is Anscombe's_quartet, a series of four modest-sized data sets that have identical descriptive statistics such as mean, variance, and correlation, but when graphed are easily seen as having very different properties (and not necessarily linearly related, either)
In native Jet SQL, as with covariance, you can calculate the correlation of two columns in a single table by means of aggregate functions. The following expressions are adapted from various queries in the sample database. As with the examples for covariance, to calculate correlation for subsets of the data, use GROUP BY clauses to define your subsets.
Adapted from "qrySet1_SQL_CorrCov_All"

                      SELECT (Avg(X * Y) - Avg(X) * Avg(Y)) / (StDevP(X) * StDevP(Y)) AS Correlation
                      FROM Set1;

                      Adapted from "qrySet1_SQL_CorrCov_Code"

                      SELECT Code, (Avg(X * Y) - Avg(X) * Avg(Y)) / (StDevP(X) * StDevP(Y)) AS Correlation
                      FROM Set1
                      GROUP BY Code;

                      Adapted from "qrySet1_SQL_CorrCov_Sect"

                      SELECT Section, (Avg(X * Y) - Avg(X) * Avg(Y)) / (StDevP(X) * StDevP(Y)) AS Correlation
                      FROM Set1
                      GROUP BY Section;

                      Adapted from "qrySet1_SQL_CorrCov_SectCode"

                      SELECT Section, Code, (Avg(X * Y) - Avg(X) * Avg(Y)) / (StDevP(X) * StDevP(Y)) AS Correlation
                      FROM Set1
GROUP BY Section, Code;Again, while using such SQL statements is not beyond the means of experienced Access users, the DCorrelation function offers a convenient way to avoid having to remember and write the necessary SQL expressions, thus simplifying the task for less experienced Access users.
Rewriting the queries above to use the DCorrelation function yields the following SQL statements:
Adapted from "qrySet1_SQL_CorrCov_All"

                      SELECT DCorrelation("X","Y","Set1") AS Correlation;

                      Adapted from "qrySet1_SQL_CorrCov_Code"

                      SELECT Code, DCorrelation("X","Y","Set1","[Code] = '" & [Code] & "'") AS Correlation
                      FROM Set1
                      GROUP BY Code;

                      Adapted from "qrySet1_SQL_CorrCov_Sect"

                      SELECT Set1.Section, DCorrelation("X","Y","Set1","[Section] = '" & [Section] & "'") AS Correlation
                      FROM Set1
                      GROUP BY Set1.Section
                      ORDER BY Set1.Section;

                      Adapted from "qrySet1_SQL_CorrCov_SectCode"

                      SELECT Section, Code, DCorrelation("X","Y","Set1","[Section] = '" & Section & "' And [Code] = '" & Code & "'") AS Correlation
                      FROM Set1
GROUP BY Section, Code;The DCorrelation function takes the following arguments:
X_Column is the name of the column containing the data for the first random variable
Y_Column is the name of the column containing the data for the second random variable
Tbl is the name of the table or query containing your data
Criteria is an optional argument containing any criteria used to select subsets of your data. Be sure to use single quotes to qualify text values and # to qualify dates in the Criteria string
For all four arguments, I strongly recommended that you place the column/table/query names in square brackets. This is mandatory if your database object names violate the usual naming rules, such as by including spaces, punctuation, keywords, etc.
The Source Code section to this article contains the VBA source code for the DCorrelation function, and the sample database provided in the [i]Sample Files[/i] section illustrates several use cases each for calculating correlation using SQL and using DCorrelation.
Source Code
Below please find the VBA source code for the DCovariance and DCorrelation functions.
Function DCovariance(X_Column As String, Y_Column As String, Tbl As String, Optional Criteria As String = "")

                          ' Function by Patrick G. Matthews

                          ' Feel free to use and distribute this code, so long as you credit authorship and indicate the URL where
                          ' you found it

                          ' This function calculates the covariance for two sets of data, and is intended for use in Microsoft
                          ' Access.  This function requires a reference to the Microsoft DAO library.

                          ' If either or both corresponding values in the paired X, Y data set are null, those records are ignored

                          ' This function is labeled according to the domain aggregate function naming convention as it behaves
                          ' similarly to the other domain aggregates

                          ' X_Column, Y_Column are the columns having the data for which you want to calculate correlation
                          ' Tbl is the source table or query for the data
                          ' Criteria defines any filtering criteria you wish to apply to the data set.  Be sure to enclose
                          '       text items in single quotes and date values in the # date qualifiers

                          ' For each of the arguments, I strongly recommend that you encase column and table names in square
                          ' brackets.  This is mandatory of the column/table name does not follow the usual rules for naming
                          ' database objects

                          Dim rs As DAO.Recordset
                          Dim SQL As String
                          Dim Counter As Long

                          On Error GoTo ErrHandler

                          ' The subquery needs an alias.  By creating a random string of 20 characters, it is virtually impossible
                          ' that the alias will duplicate a table name already used in the function call.  Since there is no need
                          ' to keep recreating this random string, it is a static variable and thus retains its state between calls

                          ' Build up SQL string

                          SQL = "SELECT Avg(" & X_Column & " * " & Y_Column & ") - Avg(" & X_Column & ") * Avg(" & Y_Column & ") As Covar " & _
                              "FROM " & Tbl & " " & _
                              "WHERE " & IIf(Trim(Criteria) <> "", Criteria & " And ", "") & X_Column & " Is Not Null And " & _
                                  Y_Column & " Is Not Null"

                          ' Open recordset

                          Set rs = CurrentDb.OpenRecordset(SQL, dbOpenSnapshot)

                          ' Set return value

                          DCovariance = rs!Covar

                          rs.Close

                          GoTo Cleanup

                      ErrHandler:
                          DCovariance = CVErr(Err)

                      Cleanup:
                          Set rs = Nothing

End FunctionFunction DCorrelation(X_Column As String, Y_Column As String, Tbl As String, Optional Criteria As String = "")
' Function by Patrick G. Matthews
' Feel free to use and distribute this code, so long as you credit authorship and indicate the URL where
' you found it
' This function calculates the correlation between two sets of data, and is intended for use in Microsoft
' Access. This function requires a reference to the Microsoft DAO library.
' If either or both corresponding values in the paired X, Y data set are null, those records are ignored
' This function is labeled according to the domain aggregate function naming convention as it behaves
' similarly to the other domain aggregates
' X_Column, Y_Column are the columns having the data for which you want to calculate correlation
' Tbl is the source table or query for the data
' Criteria defines any filtering criteria you wish to apply to the data set. Be sure to enclose
' text items in single quotes and date values in the # date qualifiers
' For each of the arguments, I strongly recommend that you encase column and table names in square
' brackets. This is mandatory of the column/table name does not follow the usual rules for naming
' database objects
Dim rs As DAO.Recordset
Dim SQL As String
Dim Counter As Long
On Error GoTo ErrHandler
' Build up SQL string
SQL = "SELECT (Avg(" & X_Column & " * " & Y_Column & ") - Avg(" & X_Column & ") * Avg(" & Y_Column & ")) / " & _
"(StDevP(" & X_Column & ") * StDevP(" & Y_Column & ")) As Correl " & _
"FROM " & Tbl & " " & _
"WHERE " & IIf(Trim(Criteria) <> "", Criteria & " And ", "") & X_Column & " Is Not Null And " & _
Y_Column & " Is Not Null"
' Open recordset
Set rs = CurrentDb.OpenRecordset(SQL, dbOpenSnapshot)
' Set return value
DCorrelation = rs!Correl
rs.Close
GoTo Cleanup
ErrHandler:
DCorrelation = CVErr(Err)
Cleanup:
Set rs = Nothing
End FunctionSample Files
This article includes two sample files:
Access database
Two tables, each with a set of data for two random variables
16 queries, demonstrating how to compute the covariance and correlation statistics for each set of sample data, as well as for various subsets, using both native Jet SQL and the new user-defined functions
VBA source code for the DCovariance and DCorrelation functions
Stats-Part-2.mdb
Excel workbook
Two worksheets corresponding to the two tables in the Access database
Computed statistics corresponding to the various queries in the Access database
Stats-Article-Part-2.xls
Implementing DCovariance and DCorrelation in Your Access Projects
To implement the DCovariance and/or DCorrelation functions in your Access projects, simply copy the source code listed for the desired functions(s) in this article, and paste the code into a regular VBA module in your Access project.
Once you have added the code to your Access project, you will be able to use the functions you added in queries, forms, reports, and in other VBA procedures in your project.
Notes:
To reach the Visual Basic editor from Access, use Alt+F11
Be sure to post the code in a "regular" module, and not a class module, form module, or report module
Make sure that the module name does not match any of the sub or function names in that module
Additional Resources
While Access has no native functions for correlation or covariance, Excel has native functions for both. The workbook posted in the Sample Files section demonstrates how to use the CORREL and COVAR functions to compute correlation and covariance, respectively. Please note that, to compute the subset correlations and covariances, I used "array formulas", as the ranges for the two variables were not contiguous.
In addition to Excel, any decent statistical analysis package will calculate correlation and covariance. For my important statistics work I prefer Minitab, but SAS, SPSS, and Mathematica will all perform well.
In addition, FMS, Inc. markets the Total Access Statistics add-in, a comprehensive statistical package that like the statistics packages above goes far beyond simple covariance and correlation. Several Experts here at Experts Exchange recommend that product.
Acknowledgments
Originally, the SQL examples and the VBA code for this article used correct, but sub-optimal, calculation logic to compute the covariance and correlation statistics. Access Expert and Page Editor harfang pointed this out to me, and he was kind enough to also supply an optimized calculation method. (My original logic used a sub-query to generate averages; the new logic dispenses with the sub-query and makes all the calculations in a single pass.)
=-=-=-=-=-=-=-=-=-=-=-=-=-
If you liked this article and want to see more from this author, please click here.
If you found this article helpful, please click the Yes button near the:
Was this article helpful?
label that is just below and to the right of this text. Thanks!
=-=-=-=-=-=-=-=-=-=-=-=-=-
Have a question about something in this article? You can receive help directly from the article author. Sign up for a free trial to get started.
Comments (7)
Commented:
Big YES vote above.
Commented:
Commented:
Commented:
Author
Commented:Not zero, but rather undefined: arithmetically, division by zero is undefined. So, if at least one of the variances is zero, then the denominator is going to be zero.
Patrick
View More