Put Some Images On Those SSRS Reports


1998: C++ - SQL Server 6.5
2000-2007: C++, VB6, C#, java - SQL Server 7.0-2005
2008-...: SQL Server 2005-2016
2014-2017: MVP Data Platform
2000-2007: C++, VB6, C#, java - SQL Server 7.0-2005
2008-...: SQL Server 2005-2016
2014-2017: MVP Data Platform
Published:
Browse All Articles > Put Some Images On Those SSRS Reports
Introduction
In the following article I’ll be discussing and demonstrating several different ways of how images can be put on a report.I’m using SQL Server Reporting Services 2008 R2 CTP, more precisely version 10.50.1352.12, but the methods explained here will work on any SSRS 2008. Furthermore I’m using the AdventureWorks2008R2 database, available at CodePlex.
The resulting report, including image files, can be downloaded from my Skydrive.
The Scenario
The marketing department has requested a product catalogue. This catalogue should contain all products produced by our two daughter companies: The Canyon Peak and Great Falls Soft. The catalogue should be grouped on company, with the next company's products starting on a new page.Further requirements are:
1. Each page needs an image in its header, with even pages displaying a different image than odd pages.
2. Each company has a logo. The logo should be displayed in the company’s header.
3. Each product has a logo. The logo should be displayed as part of the product details.
A design document containing the expected layout, including all image material, has been provided.
The Data
The following query provides us with all the data needed to produce the report:SELECT 'The Canyon Peak' as Company, 'TheCanyonPeak_logo.png' CompanyLogo,
'The Canyon Peak company specializes in all kinds of bikes, such as touring and road bikes.' CompanyDescription,
P.Name as Product, PS.Name as Subcategory, PC.Name as Category,
PP.LargePhoto, P.ListPrice, P.Weight, P.Size,
P.SizeUnitMeasureCode, P.WeightUnitMeasureCode
FROM Production.Product AS P
INNER JOIN Production.ProductSubcategory AS PS
ON PS.ProductSubcategoryID = P.ProductSubcategoryID
INNER JOIN Production.ProductCategory AS PC
ON PC.ProductCategoryID = PS.ProductCategoryID
LEFT OUTER JOIN Production.ProductProductPhoto PPP
ON PPP.ProductID = P.ProductID
LEFT OUTER JOIN Production.ProductPhoto PP
ON PPP.ProductPhotoID = PP.ProductPhotoID
WHERE PC.Name = 'Bikes' --The Canyon Peak sells bikes
and PP.ProductPhotoID > 1 --I don't want NO IMAGE AVAILABLE
UNION ALL
SELECT 'Great Falls Soft' as Company, 'GreatFallsSoft_logo.png' CompanyLogo,
'Great Falls Soft uses only the softest tissues available for those sporting clothes. And on top of that, they''re waterproof.' CompanyDescription,
P.Name as Product, PS.Name as Subcategory, PC.Name as Category,
PP.LargePhoto, P.ListPrice, P.Weight, P.Size,
P.SizeUnitMeasureCode, P.WeightUnitMeasureCode
FROM Production.Product AS P
INNER JOIN Production.ProductSubcategory AS PS
ON PS.ProductSubcategoryID = P.ProductSubcategoryID
INNER JOIN Production.ProductCategory AS PC
ON PC.ProductCategoryID = PS.ProductCategoryID
LEFT OUTER JOIN Production.ProductProductPhoto PPP
ON PPP.ProductID = P.ProductID
LEFT OUTER JOIN Production.ProductPhoto PP
ON PPP.ProductPhotoID = PP.ProductPhotoID
WHERE PC.Name = 'Clothing' --Great Falls Soft sells clothes, waterstopping soft clothes
and PP.ProductPhotoID > 1 --I don't want NO IMAGE AVAILABLE
ORDER BY Category asc, Subcategory asc, Product asc;I’m not going into the details of this query. Let’s just say that I’m manipulating data from the database in combination with some hardcoded data to get usable data for our example. I’ve added some comments to make it clear what the query is doing. If you have a look at its output, you’ll see that it produces a list of products with some additional fields.
Different Ways Of Adding Images
To get started, open up a SSRS solution, add a new report, add a data source connecting to your AdventureWorks 2008 R2 DB, and add a dataset using the above query.Embedding Images In Your Report
The first way of adding images to a report that we’ll take a look at is by embedding them inside the report. Looking at the scenario requirements described earlier, this is requirement 1.
Let’s add a header to the report. In the BIDS menu, select Report > Add Page Header.
If you don’t see the Report menu item, you probably have not selected your report. Click your report in the Design view to select it.
From the Toolbox, drag the Image report item onto the header portion of the report. Doing that will show a pop-up window, the Image Properties. By default, the Select the image source combobox is set to Embedded. Good, that’s what we need at this point. What we now need to do is import an image into the report, using the Import button.
Clicking the Import button shows a common file Open dialog. Our marketing department has given me two images for use in the header: Cloudy_banner.png and AnotherCloudy_banner.png. Let’s select the first one.
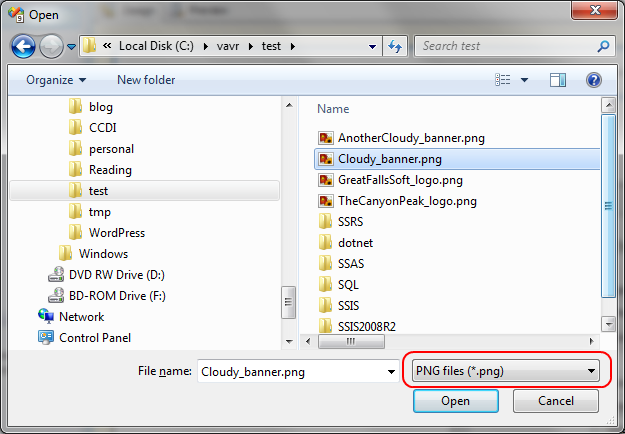
If you don’t see any images, have a look at that filter dropdown as highlighted in the screenshot above. By default this is set to JPEG files.
Here’s the result in the Image Properties:
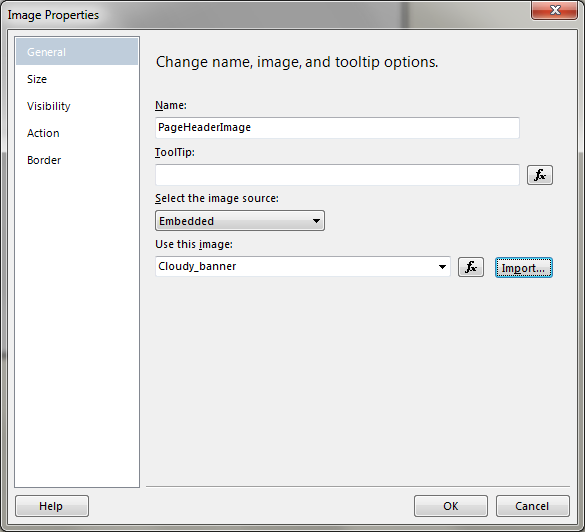
On the Size page, select Clip instead of Fit proportional. This is a setting that you’ll need to look at case per case. For our header images, Clip is the most suitable option.
Close the Image Properties window and enlarge the image placeholder so that it occupies the whole header area:
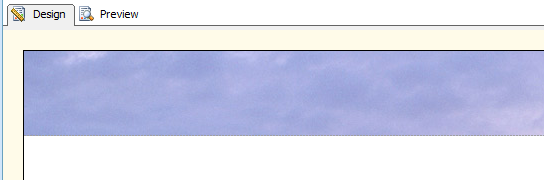
As you can see, we now have an image in the header. But we haven’t fully implemented the requirement yet. The even pages should display a different image than the uneven ones.
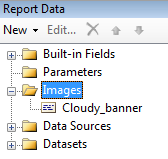
To be able to do that, we’ll first add the second banner image to the report. In the Report Data pane, locate the Images node and open it up. You’ll notice that the image that we inserted earlier can be found here.
Right-click the Images node and select Add Image.

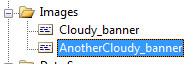
That opens up the familiar file Open dialog which was used to add the first image. So I’m now selecting the file called AnotherCloudy_banner.png, after changing the default filter to PNG. After clicking OK, the image gets added under the Images node.
With the second image added, all that remains to be done is tell the header that it should pick different images depending on the page number.
Right-click the image in the header and select Image Properties. On the General page, when you click the dropdown of the setting called Use this image, you’ll notice that there are two values now. These are the same values as displayed in the Report Data pane. And these are the values to be used in the expression that we’ll create to rotate the images depending on page number.
Click the fx button next to the dropdown and enter the following expression:
=IIF(Globals!PageNumber Mod 2 = 0, "Cloudy_banner", "AnotherCloudy_banner")This is a fairly simple expression, using the Mod operator and the IIF() function. When page number can be divided by two, which means it’s an even page number, Cloudy_banner is displayed. Otherwise the other banner is displayed.
That’s it, the report header is finished. When you have a look at the report in Preview, it should now show the second banner on the first page – this is an uneven page.
To conclude this chapter I’d like to mention that this method is usually not the preferred one. A disadvantage here is that the images are stored inside the report RDL and thus cannot be modified without altering the report itself.
Here’s the evidence:
 <EmbeddedImages>
                          <EmbeddedImage Name="Cloudy_banner">
                            <MIMEType>image/png</MIMEType>
<ImageData>iVBORw0KGgoAAAANSUhEUgAABVsAAABaCAIAAA...To have a look at the RDL yourself, just right-click the report in the Solution Explorer and select View Code.
On to requirement number two!
Displaying Images Through A URL
At the moment, the report body is still empty, so drag a Table onto it. Put the Table in the upper-left corner, remove one of the columns so that two remain, remove the Header row and make it a bit wider.
Now set the DataSetName property of the Tablix to the name of your dataset, in my case that’s dsProducts.
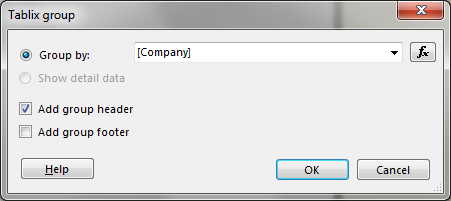
The report should display the data grouped on company, so right-click on the line that says Details in the Row Groups window part at the bottom of the Design View. Select Add Group > Parent Group.
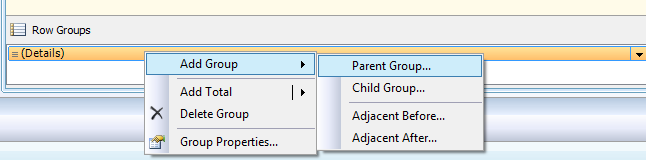
Group by Company and add a group header:
Remove the extra first column that just got generated:
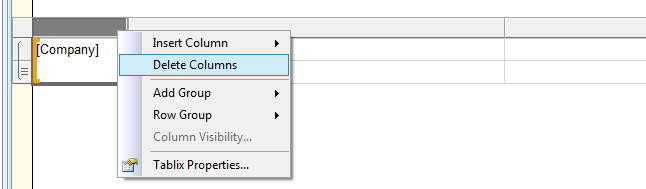
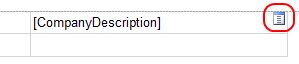
We’ve now got an empty tablix with two columns, a Details row and a Company header row. In our dataset, one of the fields is called CompanyDescription. Hover the mouse pointer above the textbox in the top-right, click the small icon that appears and choose the field from the dropdown that appears when you click the icon.
To add the company’s logo, drag an Image from the Toolbox pane into the textbox on the left of the company description. Doing this opens up the by now familiar Image Properties dialog.
Give it a good name, such as CompanyLogo, and select External as image source.
Click the fx button next to the Use this image box and enter an expression such as this one:
="file:C:\vavr\test\" + Fields!CompanyLogo.ValueWhen using External as image source, the image expression should result in a valid URL, any valid URL. In my example the files are located in a local folder called c:\vavr\test. Keep in mind that, when you deploy the report to a server, the images should by located in that same folder, this time located on the server.

By default the image gets displayed using the Fit Proportional setting. You can verify this in the Size page of the Image Properties. We want the image to get fully displayed while maintaining the aspect ratio, so leave the setting as it is. Close the image properties dialog.
Vertically enlarge the first row in our tablix to an acceptable size. In my case the marketing department specified to use a height of 1.5 inches for the company logo. With the image selected, locate the Size > Height property and set it to “1,5in”. Note that the decimal separator used here depends on your local settings.
Now have a look at the report in Preview:

Note that I’ve removed the borders of all textboxes by setting their BorderStyle property to None.
With the logo images implemented we have fulfilled requirement two. On to number three.
Retrieving Images From The Database
In this last requirement we’ll have a look at displaying images that are retrieved from the database, also known as data-bound images.
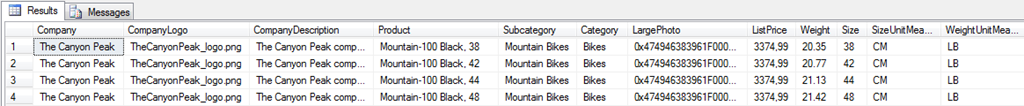
The retrieving part is actually already implemented. In our dataset there’s a field called LargePhoto, that one contains a picture of the product.
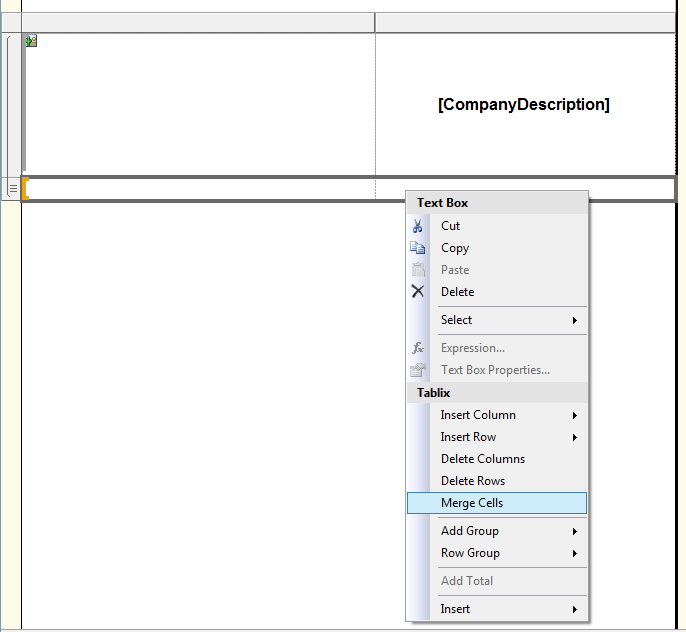
Let’s add some product details and a picture in that remaining blank row. To get full control over layout I want to make the detail part of the tablix a freestyle part. First merge the two cells together by selecting both of them, then right-click and choose Merge Cells.
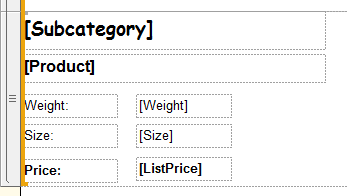
Now select a Rectangle in the Toolbox pane and drop it into the merged area. To add fields such as Subcategory and Product you can just select them from the Report Data pane and drop them inside the rectangle. I’m also adding some additional labels and fields, as shown in the next screenshot.
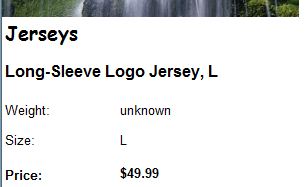
As you can see I’ve modified the fonts a bit. The rendered version:
This is the expression used for displaying the weight:
=IIF(
                          IsNothing(Fields!Weight.Value),
                          "unknown",
                          Fields!Weight.Value & " " & Fields!WeightUnitMeasureCode.Value
)And here’s the expression for the size field:
=Fields!Size.Value & " " & Fields!SizeUnitMeasureCode.ValueFor the layout of the price field I’ve just entered C in the Format property of the textbox.
With the textual product details completed, all that remains to be done is adding the product image.
From the Toolbox pane, drag an Image into the remaining whitespace in the rectangle, next to the product details. (You did keep some space available, right?)
Again we get the familiar Image Properties popup. Give it a good name, like ProductImage, and select the image source that we haven’t used yet, Database. In the Use this field dropdown, select LargePhoto, and select image/gif as MIME type.
Note: the images are stored as GIF. You can verify this by running a select on the Production.ProductPhoto table. Looking at the LargePhotoFileName field we see that the extension is .gif.
There one textbox on the General page that’s still blank. That one is called Tooltip. Click the fx button next to it and enter following formula:
=Fields!Product.ValueClick sufficient OK buttons until the properties dialog is gone, then resize the image placeholder so that it occupies the remaining whitespace.
Here’s what the result looks like in preview:

When hovering the mouse pointer above the product image, you’ll get a nice tooltip.
Conclusion
In this article I have illustrated the three possible methods of adding an image to your Reporting Services report.Have fun!
PS: so many views, so little Yes-clicks! One would start wondering...
Valentino.
References
BOL: Adding Images to a Report
Originally appeared at my blog: http://blog.hoegaerden.be/2010/07/07/put-some-images-on-those-ssrs-reports
1998: C++ - SQL Server 6.5
2000-2007: C++, VB6, C#, java - SQL Server 7.0-2005
2008-...: SQL Server 2005-2016
2014-2017: MVP Data Platform
2000-2007: C++, VB6, C#, java - SQL Server 7.0-2005
2008-...: SQL Server 2005-2016
2014-2017: MVP Data Platform
Have a question about something in this article? You can receive help directly from the article author. Sign up for a free trial to get started.
Comments (3)
Commented:
This post is very very helpful but i have one question on the database part. Is the image that is in the database the actual image or the location where the image is located in the folder. I am planning to use the database but the image does not show and noticed that the image imported in the sql table is stored as binary. It does not show like in your note that i am able to see the filename extension.
Can you clarify what should be the data in the LargePhoto field that you have mentioned?
Thanks
Commented:
Author
Commented:tvae: it seems that I've missed your question somehow. It's probably too late now but I'll answer anyway :)
The LargePhoto field stores the actual image, not a url, in a varbinary(max) field.