arghosrho
asked on
Creating SLA views in SCOM 2012
Dear Experts.
i have an outstanding issue with my new SCOM 2012 organization.
im truying to create an SLA view to monitor a group of three servers as in general OS health to show which of the servers are up or down.
im wondering how this could be done.
best regards
Arghos.
i have an outstanding issue with my new SCOM 2012 organization.
im truying to create an SLA view to monitor a group of three servers as in general OS health to show which of the servers are up or down.
im wondering how this could be done.
best regards
Arghos.
ASKER
i will download the MP and il let you know how it turns out. as the final goal is to show that server group in an SLA and when something goes wrong the SLA circle turns red. that is what my employer want to see,
a second question on the side.
do u have any suggestion on how to do that without the SLA view.
showing a group of servers in a visualization and when any of the servers goes down a red light goes on.? sounds simple but this is what my employer want.
a second question on the side.
do u have any suggestion on how to do that without the SLA view.
showing a group of servers in a visualization and when any of the servers goes down a red light goes on.? sounds simple but this is what my employer want.
Hi
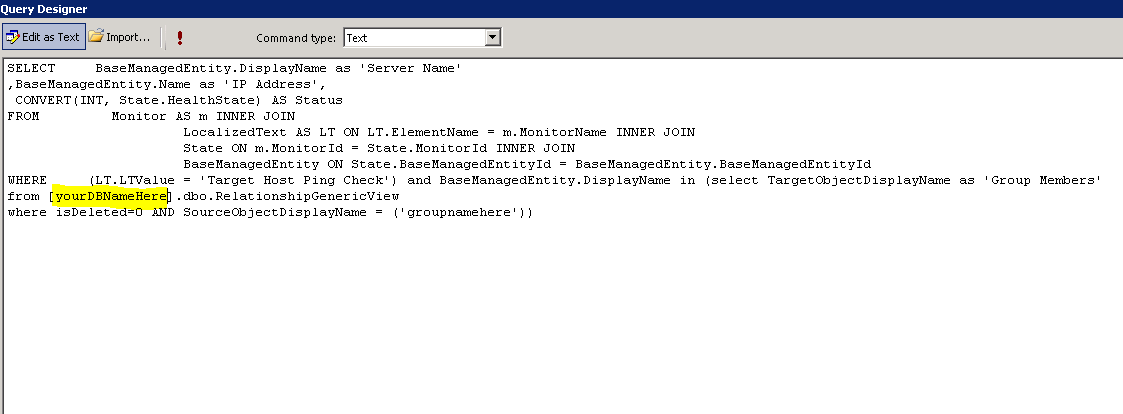
What you could do is create a "dashboard" with SSRS report and have it update/refresh the report every 5 min or more depending on what is required or you could create a PowerView/PowerPivot sheet in Excel and connect to your DB and use a query as below.
You will notice I used the 'Target Host Ping Check' which is the monitor that comes with that Ping MP that I told you about earlier, you can then also filter the query further to only the server names you need to see, then in SSRS or Excel you can create indicators for the "healthstate" value 1 being healthy and 3 being critical and it would change colours like a traffic light :)
Below is a view of my output which I would then use to create the graphic view from

So there are many other ways you can use the data from the SCOM db to present it in another system, even creating a BI dashboard with Microsoft BI possibly.
This has been our requirement as the default views are a little restricted for our environment so we have created many like these.
Hope this helps
What you could do is create a "dashboard" with SSRS report and have it update/refresh the report every 5 min or more depending on what is required or you could create a PowerView/PowerPivot sheet in Excel and connect to your DB and use a query as below.
SELECT     BaseManagedEntity.DisplayName as 'Server Name'
,BaseManagedEntity.Name as 'IP Address',
 State.HealthState
FROM         Monitor AS m INNER JOIN
                      LocalizedText AS LT ON LT.ElementName = m.MonitorName INNER JOIN
                      State ON m.MonitorId = State.MonitorId INNER JOIN
                      BaseManagedEntity ON State.BaseManagedEntityId = BaseManagedEntity.BaseManagedEntityId
WHERE (LT.LTValue = 'Target Host Ping Check')You will notice I used the 'Target Host Ping Check' which is the monitor that comes with that Ping MP that I told you about earlier, you can then also filter the query further to only the server names you need to see, then in SSRS or Excel you can create indicators for the "healthstate" value 1 being healthy and 3 being critical and it would change colours like a traffic light :)
Below is a view of my output which I would then use to create the graphic view from
So there are many other ways you can use the data from the SCOM db to present it in another system, even creating a BI dashboard with Microsoft BI possibly.
This has been our requirement as the default views are a little restricted for our environment so we have created many like these.
Hope this helps
ASKER
well the thing is we need a simple webview to show that employing excel isnt exactly what we want.
but id like to get more information about the SSRS reports in a dhasboardview. can u please give me some examples on how to do that.
i already have created a group with 3 servers so how can i do that?
excuse me if i come forward like a noob
but id like to get more information about the SSRS reports in a dhasboardview. can u please give me some examples on how to do that.
i already have created a group with 3 servers so how can i do that?
excuse me if i come forward like a noob
Hi
Nothing wrong with asking for help on something you haven't tried or implemented so never worry about sounding like a noob :)
You could look at the following to get you started http://www.systemcentercentral.com/creating-a-custom-report-for-scom-2007-r2-with-sql-2008-reporting-in-microsoft-visual-studio-2008/
This is using VS 2008, you could then instead of inserting a matrix you could insert a indicator instead and then set your indicators accordingly.
You can also use the above link idea to create other different views/reports, you would then take the .rdl file and upload it to your SCOM report server http://"SCOMreportserver"/reports
I have attached a example .rdl that you could edit in report editor or in VS 2008
You will need to change the data source to your own sql server name as well as the DB name of your datawarehouse db, also you would have to change the group name to your own created group.
Here are some screen shots


You can then customize this report to your own configuration as well as add an auto refresh into the report.
Hope this will help and sure its more info, you will also see the new updated query if you right click dataset1 and click query, which will include the group name input as well as the spot where you will change the DW name to your production DW name.
When creating the data source connection, it will connect to your operationsmanager db not the DW.
Let me know if you don't understand anything
Thanks
SCOM-Indicator-Example.rdl
Nothing wrong with asking for help on something you haven't tried or implemented so never worry about sounding like a noob :)
You could look at the following to get you started http://www.systemcentercentral.com/creating-a-custom-report-for-scom-2007-r2-with-sql-2008-reporting-in-microsoft-visual-studio-2008/
This is using VS 2008, you could then instead of inserting a matrix you could insert a indicator instead and then set your indicators accordingly.
You can also use the above link idea to create other different views/reports, you would then take the .rdl file and upload it to your SCOM report server http://"SCOMreportserver"/reports
I have attached a example .rdl that you could edit in report editor or in VS 2008
You will need to change the data source to your own sql server name as well as the DB name of your datawarehouse db, also you would have to change the group name to your own created group.
Here are some screen shots
You can then customize this report to your own configuration as well as add an auto refresh into the report.
Hope this will help and sure its more info, you will also see the new updated query if you right click dataset1 and click query, which will include the group name input as well as the spot where you will change the DW name to your production DW name.
When creating the data source connection, it will connect to your operationsmanager db not the DW.
Let me know if you don't understand anything
Thanks
SCOM-Indicator-Example.rdl
ASKER
i think i got the soul of it.
but well let me get e bit deaper on the goal.
my employer want a webpage to show the state, and what they want is something really simplistic so for example. we have a group of servers server1, server2 and server three.
what is needed is that a webpage should appear that shows green as long as these three servers are online and working as soon as any of the servers goes down this webpage should show a red light.
That is exactly in the .rdl file I attached, it is simple small report that can be customized for your needs, it can be displayed on a LCD screen and will show you a green or red depending on the state of the server being up or down.
The previous post will give you all that you need to get that going.
Nothing else to do :)
The previous post will give you all that you need to get that going.
Nothing else to do :)
ASKER
do we have to have the SCom reporting for this? as this is not installed.
well you have the OperationsManager and OperationsManagerDW database don't you ? so this would be directly running a query on both from a SSRS report.
ASKER
can u assit me a bit in getting the free MP to work and include its result in a SLA view? i wanna start with this and then go all the way to the custom reports.
Well all you need to do is download the MP from the site I gave you already and then there will be a config document that is easy to read on how to setup the hosts (ping from) and the targets (servers to ping), do you have SCOM 2007 or SCOM 2012 ?
Once you have that going then let me know then I will try help you with the SLA view.
If you get stuck with the Ping MP let me know.
Once you have that going then let me know then I will try help you with the SLA view.
If you get stuck with the Ping MP let me know.
ASKER
i have scom 2012. and i dont seem to find the configuration document attached.
the config document wasn't attached, but when you go to the link and download the MP, there is a PDF document.
http://www.opslogix.com/download-ping-management-pack
The files mp files as well as the document will be in the download.
http://www.opslogix.com/download-ping-management-pack
The files mp files as well as the document will be in the download.
ASKER
good ive done the basic configuration and i can some results.
but how am i supposed to translate that to an SLA. i still get a grey result.
i also want to make diffrent sals to represent diffrent server.
but how am i supposed to translate that to an SLA. i still get a grey result.
i also want to make diffrent sals to represent diffrent server.
So you have done your configuration of the Hosts (Ping from) and targets (to ping) ? the first time the MP is imported it will not show green results as it will still be processed by SCOM and discoveries run. If your agent is grey then the management service isn't running on them possibly.
Also there seems to be a know issue even with SCOM 2012 SP1 where if you had to open the web console the SLA view would show green but in the console itself it will show grey, what you could also try do is change ur SLA value from 99 % to 98 % or lower.
If you want more SLA views for each server group you would either have to create a SLA for each server group which are all the same but just the groups would be different or you would have to create a separate SLA dashboard for each.
In my opinion the SLA view isn't the greatest
ASKER
im monitoring a couple of servers with the MP now, and they are all fine and green. i just dont know how to put this output to an SLA
ASKER
well what im missing is how to get the information from this MP to a SLA ? i just cant get it to work
the mp shows healthy serves the sla shows nothing at all.
the mp shows healthy serves the sla shows nothing at all.
Well you would go into your Authoring TAB, click on Service Level Tracking and then create a new SLA, name it whatever you want.
Here are some screen shots attached, you would then just create a service level objective for each group targeted to each group, then create your own SLA dashboard in the Monitoring view and add your newly created SLA.
SLA1.PNG
SLA2.PNG
SLA3.PNG
Here are some screen shots attached, you would then just create a service level objective for each group targeted to each group, then create your own SLA dashboard in the Monitoring view and add your newly created SLA.
SLA1.PNG
SLA2.PNG
SLA3.PNG
ASKER
does the choice of managment pack in the first screen make a diffrence?
no, you choose the custom MP that you would want to put it into, obviously not the default MP or any other sealed MP, create your own.
ASKER
ok i managed to get it to work so far.
now i have 8 servers in the MP can i actually make 2 SLA views each to show 4 servers of these 8?
now i have 8 servers in the MP can i actually make 2 SLA views each to show 4 servers of these 8?
yes, but you would have to create a group for one set of 4 and another group for the other set of 4 and then just use the one SLA created but then add 2 Monitor SLO's each targeted to each group.
ASKER
groups you mean as in authoring groups and then creating a group with certain members?
in case yes.
4 of these server are already in a group. in the members of the group what i choose from all the availble options? as creating a group requires choosing certain options int he members pane.
i know i exhausted you but im really in a bad need of getting this right
in case yes.
4 of these server are already in a group. in the members of the group what i choose from all the availble options? as creating a group requires choosing certain options int he members pane.
i know i exhausted you but im really in a bad need of getting this right
ASKER CERTIFIED SOLUTION
membership
This solution is only available to members.
To access this solution, you must be a member of Experts Exchange.
There isn't a up/down view per say, more of a "availability" which could be a specific component of the server or the server as a whole.
you might want to take a look at getting the free Opslogix Ping MP found here http://www.opslogix.com/download-ping-management-pack and then maybe specify the ping status monitor in your SLA criteria for those servers.
Goodluck