AdrianME
asked on
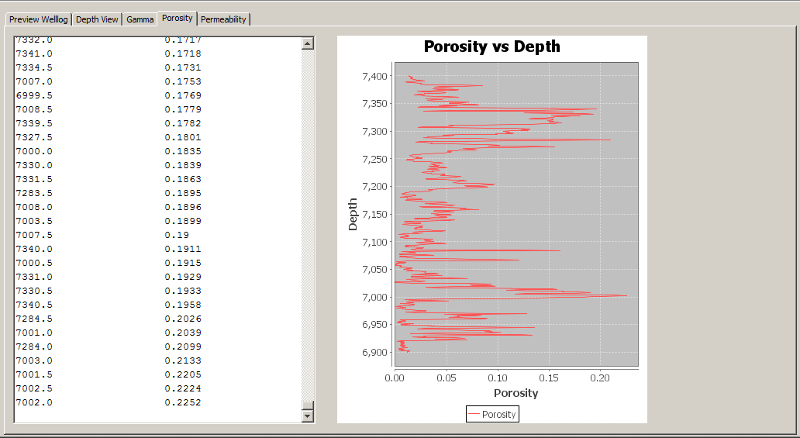
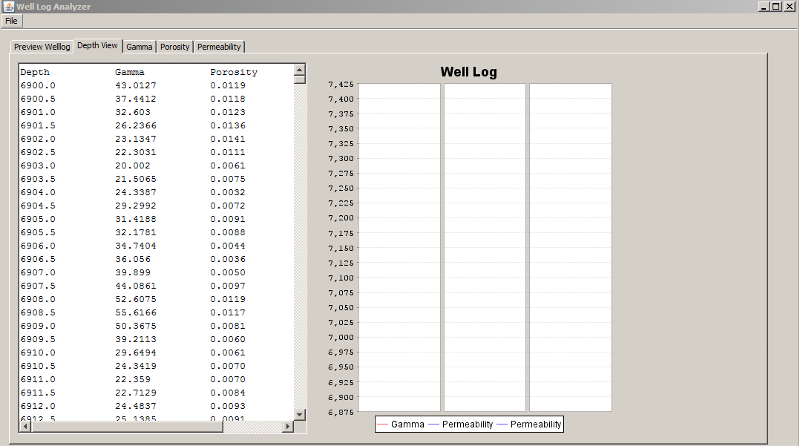
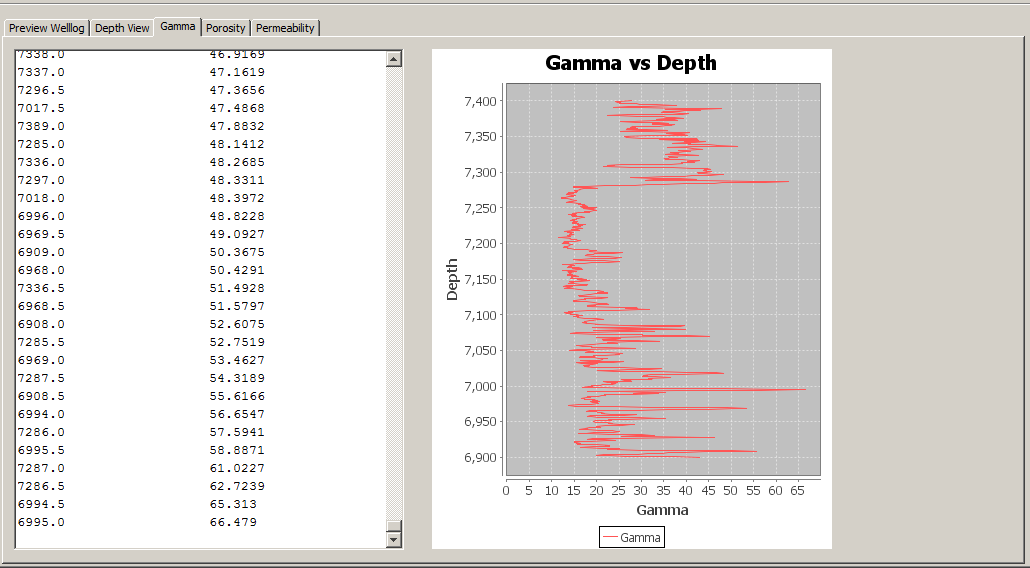
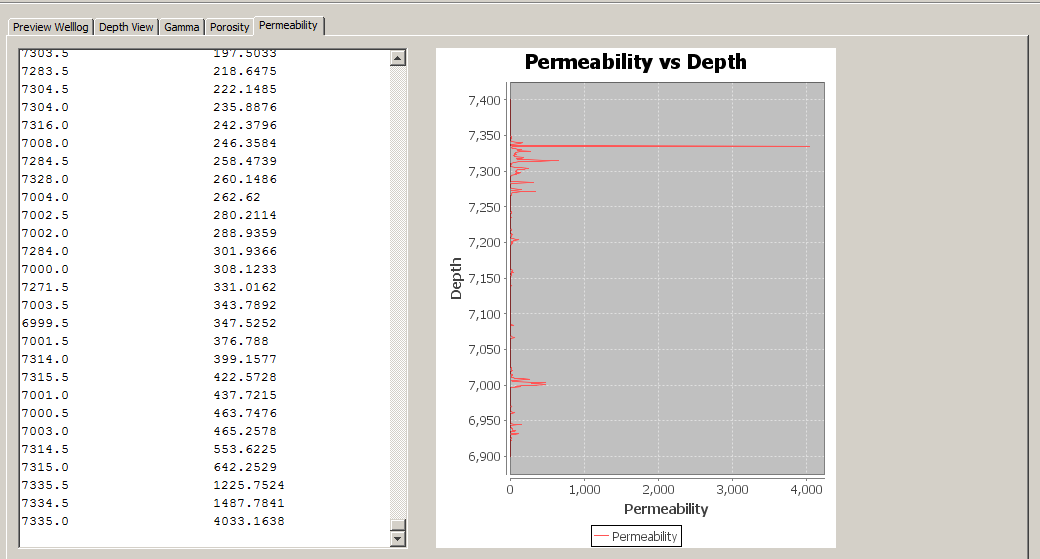
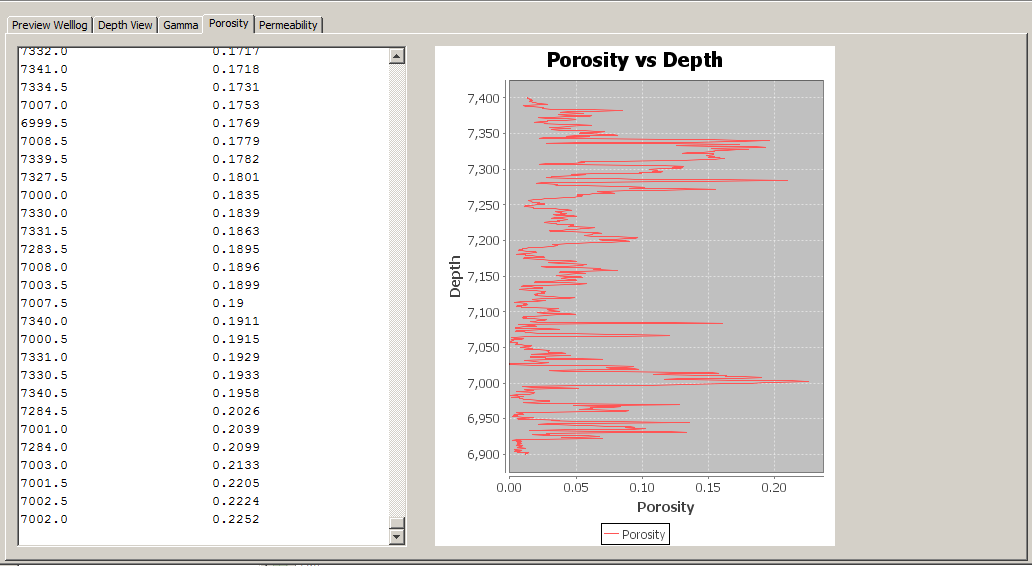
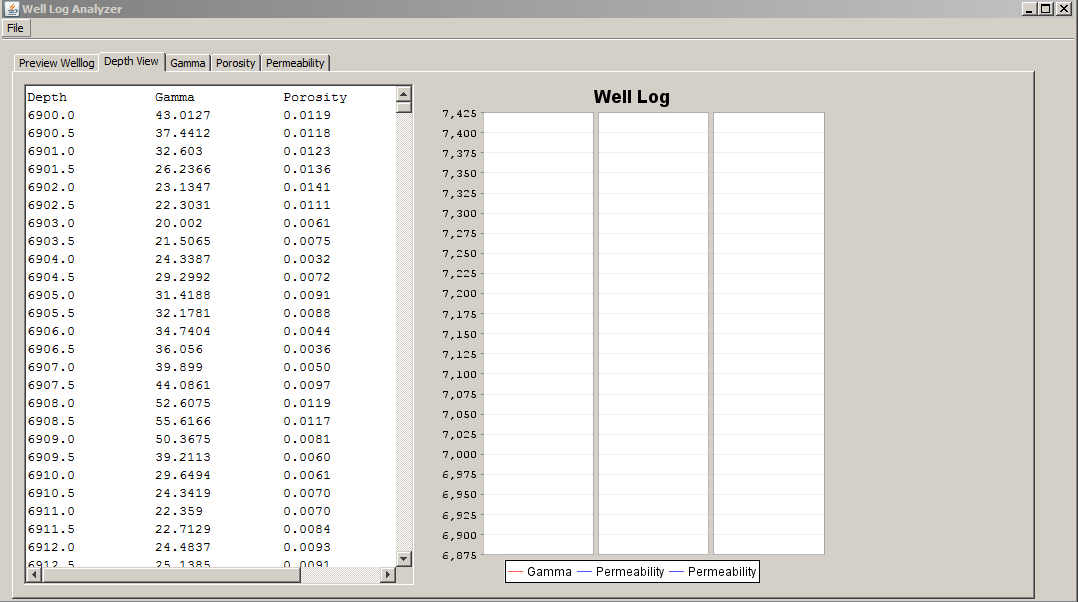
How do I make a graph show up in a JFreeChart in CombinedRangeXYPlot?
I am trying to create a plot that shows 3 series that share the same range. I am using CombinedRangeXYPlot to do this. I have three other plots as well in the same method that are displaying the plots correctly but all the series are separate.
I was thinking that it could be the X axis because it is small on some series and very large on the others.. I can't figure out how to correct this problem.
Thank you in advance.
//Displaying Series correctly but separately


//Not Displaying the Series
//Code
I was thinking that it could be the X axis because it is small on some series and very large on the others.. I can't figure out how to correct this problem.
Thank you in advance.
//Displaying Series correctly but separately
//Not Displaying the Series
//Code
public class MyFileClass
{
    private Scanner input; //initialize input in java
    public String myPath;

      public void setPathString(String pat)
   {
     myPath=pat;
   }
  //public void inputFile  **START**
    public void inputFile()
    {
        try
        {
            input = new Scanner (new File(myPath));

        } //end try
        catch (FileNotFoundException fileNotFoundException)
        {
            System.err.println("Error File Not Found");
            System.exit (1);
        } //end catch
    }//public void inputFile **END**
    //public void **START** Read Records from file
    public void readLog()
    {

        //object to be written to screen
        WellLog log = new WellLog();

        //Array List for Plotting Well Log Data
        List depth_list = new ArrayList();
        List gamma_list = new ArrayList();
        List porosity_list = new ArrayList();
        List permeability_list = new ArrayList();

        //Binary Search Tree
        BinaryTree BSTg = new BinaryTree();//Gamma
        BinaryTree BSTp = new BinaryTree();//Porosity
        BinaryTree BSTm = new BinaryTree();//Permeability

        //Headers for Depth View
        textAreaDepthView.append("Depth" + "\t\t" + "Gamma" + "\t\t" + "Porosity" + "\t" + "Permeability\n");

        try
        {
            //Loops through the text file
            while (input.hasNext())
            {
                //Record Vaules from input source
                log.setDepth(input.nextDouble());//Records Depth
                log.setGamma(input.nextDouble());//Records Gamma
                input.nextDouble();//Skips
                log.setPorosity(input.nextDouble());//Records Porosity
                input.nextDouble();//Skips
                log.setPermeability(input.nextDouble());//Records Permeability
                input.nextDouble();//Skips

                //Converts Depth from  Double to String
                String aS1 = Double.toString(log.getDepth());
                String aS2 = Double.toString(log.getGamma());
                String aS3 = Double.toString(log.getPorosity());
                String aS4 = Double.toString(log.getPermeability());

                //Inserts Values into Depth View
                textAreaDepthView.append(aS1 + "\t\t" + aS2 + "\t\t" + aS3 + "\t\t" + aS4 + "\n");

                //Binary Search Tree Insert
                BSTg.insert(log.getDepth(), log.getGamma());
                BSTp.insert(log.getDepth(), log.getPorosity());
                BSTm.insert(log.getDepth(), log.getPermeability());

                //Data to Array Lists
                depth_list.add(log.getDepth());
                gamma_list.add(log.getGamma());
                porosity_list.add(log.getPorosity());
                permeability_list.add(log.getPermeability());

            }//end while

        }//end try
        catch (NoSuchElementException elementException)
        {
            System.err.println("File improperly formed.");
            input.close();
            System.exit(1);
        }//end no such element catch
        catch (IllegalStateException stateException)
        {
            System.err.println("Error reading from file.");
            System.exit(1);
        }//end file error catch

        //Print to Text Areas
        textAreaGamma.append("Depth" + "\t\t\t" + "Gamma\n");//Titles
        BSTg.print_inorderg();//Data to Text Box
        textAreaPorosity.append("Depth" + "\t\t\t" + "Porosity\n");//Titles
        BSTp.print_inorderp();//Data to Text Box
        textAreaPermeability.append("Depth" + "\t\t\t" + "Permeability\n");//Titles
        BSTm.print_inorderm();//Data to Text Box


        int n_points = 250;
        double[] y_of_x;
        double[] ex;
        y_of_x = new double[n_points];
        ex = new double[n_points];

        //Creates Series Object for XYLineChart
        XYSeries series = new XYSeries("Gamma");
        XYSeries series1 = new XYSeries("Porosity");
        XYSeries series2 = new XYSeries("Permeability");

        //Creates Series Object for CombinedRangeXYPlot
        XYSeries series30 = new XYSeries("Gamma");
        XYSeries series31 = new XYSeries("Porosity");
        XYSeries series32 = new XYSeries("Permeability");

        int length = BSTg.size();//Length of Array

        for (int i=0; i<length; i++){

            //Converts String to Double
            double depths = Double.parseDouble(depth_list.get(i).toString());
            double gammas = Double.parseDouble(gamma_list.get(i).toString());
            double porositys = Double.parseDouble(porosity_list.get(i).toString());
            double permeabilitys = Double.parseDouble(permeability_list.get(i).toString());

            //Inserts Data into Series for XYLineChart
            series.add((double)depths, (double)gammas);
            series1.add((double)depths, (double)porositys);
            series2.add((double)depths, (double)permeabilitys);

            //Inserts Data into Series for CombinedRangeXYPlot
            series30.add((double)gammas, (double)depths);
            series31.add((double)porositys, (double)depths);
            series32.add((double)permeabilitys, (double)depths);

    }//end method readlog


        //Plot Gamma -> XYLineChart
        XYDataset dataset = new XYSeriesCollection(series);
        JFreeChart chart = ChartFactory.createXYLineChart(
            "Gamma vs Depth",
            "Depth",
            "Gamma",
            dataset,
            org.jfree.chart.plot.PlotOrientation.HORIZONTAL,
            true,
            false,
            false);

        BufferedImage image = chart.createBufferedImage(400,500);
        gammaPlot.setIcon(new ImageIcon(image));
        XYDataset dataset1 = new XYSeriesCollection(series1);
        JFreeChart chart1 = ChartFactory.createXYLineChart(
            "Porosity vs Depth",
            "Depth",
            "Porosity",
            dataset1,
            org.jfree.chart.plot.PlotOrientation.HORIZONTAL,
            true,
            false,
            false);
        BufferedImage image1 = chart1.createBufferedImage(400,500);
        porosityPlot.setIcon(new ImageIcon(image1));

        //Plot Permeability-> XYLineChart
        XYDataset dataset2 = new XYSeriesCollection(series2);
        JFreeChart chart2 = ChartFactory.createXYLineChart(
                "Permeability vs Depth",
                "Depth",
                "Permeability",
                dataset2,
                org.jfree.chart.plot.PlotOrientation.HORIZONTAL,
                true,
                false,
                false);

        BufferedImage image2 = chart2.createBufferedImage(400, 500);
        permeabilityPlot.setIcon(new ImageIcon(image2));

        //Datasets for Combined RangeXYPlot
        XYDataset dataset30 = new XYSeriesCollection(series30);
        XYDataset dataset31 = new XYSeriesCollection(series31);
        XYDataset dataset32 = new XYSeriesCollection(series32);


        CombinedRangeXYPlot parent = new CombinedRangeXYPlot(new NumberAxis(""));

        XYItemRenderer renderer1 = new StandardXYItemRenderer();
        XYItemRenderer renderer2 = new StandardXYItemRenderer();
        XYItemRenderer renderer3 = new StandardXYItemRenderer();

        //LEFT
        XYPlot subplot1 = new XYPlot(dataset30, null, new NumberAxis(null), renderer1);
        NumberAxis axis1 = (NumberAxis) subplot1.getRangeAxis();
        axis1.setTickLabelFont(new Font("Monospaced", Font.PLAIN, 11));
        axis1.setLabelFont(new Font("SansSerif", Font.PLAIN, 11));
        axis1.setAutoRangeIncludesZero(false);
        parent.add(subplot1, 1);

        //MIDDLE
        XYPlot subplot2 = new XYPlot(dataset31, null, new NumberAxis(null), renderer2);
        NumberAxis axis2 = (NumberAxis) subplot2.getRangeAxis();
        axis2.setTickLabelFont(new Font("Monospaced", Font.PLAIN, 11));
        axis2.setLabelFont(new Font("SansSerif", Font.PLAIN, 11));
        axis2.setAutoRangeIncludesZero(false);
        parent.add(subplot2, 1);

        //RIGHT
        XYPlot subplot3 = new XYPlot(dataset32, null, new NumberAxis(null), renderer2);
        NumberAxis axis3 = (NumberAxis) subplot2.getRangeAxis();
        axis3.setTickLabelFont(new Font("Monospaced", Font.PLAIN, 11));
        axis3.setLabelFont(new Font("SansSerif", Font.PLAIN, 11));
        axis3.setAutoRangeIncludesZero(false);
        parent.add(subplot3, 1);

        JFreeChart chart3 = new JFreeChart("Well Log", parent);
        BufferedImage image3 = chart3.createBufferedImage(400, 500);
        depthPlot.setIcon(new ImageIcon(image3));


    }
This is the general instruction how to cobine charts
http://www.jfree.org/phpBB2/viewtopic.php?f=3&t=29530
http://www.jfree.org/phpBB2/viewtopic.php?f=3&t=29530
ASKER
Yes, I am trying to show three series that share the same Y axis.
I have them set up as subplots but I can't get the series (lines) to display on the subplots and it's the last screenshot shown.
I have them set up as subplots but I can't get the series (lines) to display on the subplots and it's the last screenshot shown.
I understand, so you still want to show them separately.
Which JFreeChart and JCommons jar are you using?
Which JFreeChart and JCommons jar are you using?
ASKER
I included a screenshot below.

So you used the latest 1.0.13 and 1.0.16.
I was asking because I had previously that code which would not run with the latest.
OK, try to look at the manual, meybe you'd find something, I'll later
try to play with it also.
Do you think it owuld be OK with you if we orient these
three plots with the common axis horizontally?
Not that I know for sure, but it may be easier to find
such horizontal example somehwere. Vertically, like you showed
looks more rare, though it probably should allow it.
ASKER
Thanks for all your help. I have to code it to appear vertically because it is a well log which displays properties of the well vertically.
It is similar to the link I am showing below.
http://www.oilandgasgeologist.com/oil%20and%20gas%20geologist/Images/well%20log%20copy.jpg
Ideally, the values should get larger going down but I am settling for the upside down orientation due to time constraints.
It is similar to the link I am showing below.
http://www.oilandgasgeologist.com/oil%20and%20gas%20geologist/Images/well%20log%20copy.jpg
Ideally, the values should get larger going down but I am settling for the upside down orientation due to time constraints.
Well, after all if we draw it horizonatlly we can then make transformation, yes, it should be doable.
I'm not that great specialist in JFreeChart.
Maybe someone helps with that sooner, if not I'll also try to play with it.
In the mantime look at the manual, maybe you'll find something there
I'm not that great specialist in JFreeChart.
Maybe someone helps with that sooner, if not I'll also try to play with it.
In the mantime look at the manual, maybe you'll find something there
Look at page 98-99 of the manual - exactly about Combined Range XY plot which you mentioned - it looks like
it is close to what you need and there is an example of the
code - look at that - maybe that will serve you.
If it is not clear - let me know.
If you want me to try to play with it - I'd probably need to get some
data - otherwise how would I execute your code?
it is close to what you need and there is an example of the
code - look at that - maybe that will serve you.
If it is not clear - let me know.
If you want me to try to play with it - I'd probably need to get some
data - otherwise how would I execute your code?
ASKER
I included the full code below along with a .las file that is to be open with the code.
Thanks again.
Thanks again.
/*
* To change this template, choose Tools | Templates
* and open the template in the editor.
*/
/*
* WellLogAnalyzer.java
*
* Created on May 3, 2011, 8:46:56 AM
*/
package jfilechooserdemo.resources;
import java.awt.Font;
import java.lang.IllegalStateException;
import java.lang.Number.*;
import java.lang.Number.*;
import org.jfree.data.xy.*;
import org.jfree.chart.*;
import java.awt.image.BufferedImage;
import java.io.File;
import java.io.FileNotFoundException;
import java.io.FileReader;
import java.io.IOException;
import java.util.ArrayList;
import java.util.List;
import java.util.NoSuchElementException;
import java.util.Scanner;
import javax.swing.ImageIcon;
import javax.swing.JFileChooser;
import javax.swing.UIManager;
import org.jfree.chart.axis.NumberAxis;
import org.jfree.chart.plot.CombinedDomainXYPlot;
import org.jfree.chart.plot.CombinedRangeXYPlot;
import org.jfree.chart.plot.XYPlot;
import org.jfree.chart.renderer.xy.StandardXYItemRenderer;
import org.jfree.chart.renderer.xy.XYItemRenderer;
class MyCustomFilter extends javax.swing.filechooser.FileFilter {
@Override
public boolean accept(File file) {
// Allow only directories, or files with ".txt" extension
return file.isDirectory() || file.getAbsolutePath().endsWith(".las");
}
@Override
public String getDescription() {
// This description will be displayed in the dialog,
// hard-coded = ugly, should be done via I18N
return "Well Logs (*.las)";
}
}
/**
*
* @author
*/
public class WellLogAnalyzer extends javax.swing.JFrame {
/** Creates new form WellLogAnalyzer */
public WellLogAnalyzer() {
initComponents();
}
//Public Class Well Log **START**
public class WellLog {
private double depth;
private double gamma;
private double porosity;
private double permeability;
public WellLog() {
this(0.0, 0.0, 0.0, 0.0);
}
//WellLog Methods **START**
public WellLog(double dep, double gam, double por, double per) {
setDepth(dep);
setGamma(gam);
setPorosity(por);
setPermeability(per);
}
public void setDepth(double dep) {
depth = dep;
}
public double getDepth() {
return depth;
}
public void setGamma(double gam) {
gamma = gam;
}
public double getGamma() {
return gamma;
}
public void setPorosity(double por) {
porosity = por;
}
public double getPorosity() {
return porosity;
}
public void setPermeability(double per) {
permeability = per;
}
public double getPermeability() {
return permeability;
}//WellLog Methods **END**
}
//Public Class Well Log **END**
//Public Class MyFileClass **START**
public class MyFileClass
{
private Scanner input; //initialize input in java
public String myPath;
public void setPathString(String pat)
{
myPath=pat;
}
//public void inputFile **START**
public void inputFile()
{
try
{
input = new Scanner (new File(myPath));
} //end try
catch (FileNotFoundException fileNotFoundException)
{
System.err.println("Error File Not Found");
System.exit (1);
} //end catch
}//public void inputFile **END**
//public void **START** Read Records from file
public void readLog()
{
//object to be written to screen
WellLog log = new WellLog();
//Array List for Plotting Well Log Data
List depth_list = new ArrayList();
List gamma_list = new ArrayList();
List porosity_list = new ArrayList();
List permeability_list = new ArrayList();
//Binary Search Tree
BinaryTree BSTg = new BinaryTree();//Gamma
BinaryTree BSTp = new BinaryTree();//Porosity
BinaryTree BSTm = new BinaryTree();//Permeability
//Headers for Depth View
textAreaDepthView.append("Depth" + "\t\t" + "Gamma" + "\t\t" + "Porosity" + "\t" + "Permeability\n");
try
{
//Loops through the text file
while (input.hasNext())
{
//Record Vaules from input source
log.setDepth(input.nextDouble());//Records Depth
log.setGamma(input.nextDouble());//Records Gamma
input.nextDouble();//Skips
log.setPorosity(input.nextDouble());//Records Porosity
input.nextDouble();//Skips
log.setPermeability(input.nextDouble());//Records Permeability
input.nextDouble();//Skips
//Converts Depth from Double to String
String aS1 = Double.toString(log.getDepth());
String aS2 = Double.toString(log.getGamma());
String aS3 = Double.toString(log.getPorosity());
String aS4 = Double.toString(log.getPermeability());
//Inserts Values into Depth View
textAreaDepthView.append(aS1 + "\t\t" + aS2 + "\t\t" + aS3 + "\t\t" + aS4 + "\n");
//Binary Search Tree Insert
BSTg.insert(log.getDepth(), log.getGamma());
BSTp.insert(log.getDepth(), log.getPorosity());
BSTm.insert(log.getDepth(), log.getPermeability());
//Data to Array Lists
depth_list.add(log.getDepth());
gamma_list.add(log.getGamma());
porosity_list.add(log.getPorosity());
permeability_list.add(log.getPermeability());
}//end while
}//end try
catch (NoSuchElementException elementException)
{
System.err.println("File improperly formed.");
input.close();
System.exit(1);
}//end no such element catch
catch (IllegalStateException stateException)
{
System.err.println("Error reading from file.");
System.exit(1);
}//end file error catch
//Print to Text Areas
textAreaGamma.append("Depth" + "\t\t\t" + "Gamma\n");//Titles
BSTg.print_inorderg();//Data to Text Box
textAreaPorosity.append("Depth" + "\t\t\t" + "Porosity\n");//Titles
BSTp.print_inorderp();//Data to Text Box
textAreaPermeability.append("Depth" + "\t\t\t" + "Permeability\n");//Titles
BSTm.print_inorderm();//Data to Text Box
int n_points = 250;
double[] y_of_x;
double[] ex;
y_of_x = new double[n_points];
ex = new double[n_points];
//Creates Series Object for XYLineChart
XYSeries series = new XYSeries("Gamma");
XYSeries series1 = new XYSeries("Porosity");
XYSeries series2 = new XYSeries("Permeability");
//Creates Series Object for CombinedRangeXYPlot
XYSeries series30 = new XYSeries("Gamma");
XYSeries series31 = new XYSeries("Porosity");
XYSeries series32 = new XYSeries("Permeability");
int length = BSTg.size();//Length of Array
for (int i=0; i<length; i++){
//Converts String to Double
double depths = Double.parseDouble(depth_list.get(i).toString());
double gammas = Double.parseDouble(gamma_list.get(i).toString());
double porositys = Double.parseDouble(porosity_list.get(i).toString());
double permeabilitys = Double.parseDouble(permeability_list.get(i).toString());
//Inserts Data into Series for XYLineChart
series.add((double)depths, (double)gammas);
series1.add((double)depths, (double)porositys);
series2.add((double)depths, (double)permeabilitys);
//Inserts Data into Series for CombinedRangeXYPlot
series30.add((double)gammas, (double)depths);
series31.add((double)porositys, (double)depths);
series32.add((double)permeabilitys, (double)depths);
}//end method readlog
//Plot Gamma -> XYLineChart
XYDataset dataset = new XYSeriesCollection(series);
JFreeChart chart = ChartFactory.createXYLineChart(
"Gamma vs Depth",
"Depth",
"Gamma",
dataset,
org.jfree.chart.plot.PlotOrientation.HORIZONTAL,
true,
false,
false);
BufferedImage image = chart.createBufferedImage(400,500);
gammaPlot.setIcon(new ImageIcon(image));
XYDataset dataset1 = new XYSeriesCollection(series1);
JFreeChart chart1 = ChartFactory.createXYLineChart(
"Porosity vs Depth",
"Depth",
"Porosity",
dataset1,
org.jfree.chart.plot.PlotOrientation.HORIZONTAL,
true,
false,
false);
BufferedImage image1 = chart1.createBufferedImage(400,500);
porosityPlot.setIcon(new ImageIcon(image1));
//Plot Permeability-> XYLineChart
XYDataset dataset2 = new XYSeriesCollection(series2);
JFreeChart chart2 = ChartFactory.createXYLineChart(
"Permeability vs Depth",
"Depth",
"Permeability",
dataset2,
org.jfree.chart.plot.PlotOrientation.HORIZONTAL,
true,
false,
false);
BufferedImage image2 = chart2.createBufferedImage(400, 500);
permeabilityPlot.setIcon(new ImageIcon(image2));
//Datasets for Combined RangeXYPlot
XYDataset dataset30 = new XYSeriesCollection(series30);
XYDataset dataset31 = new XYSeriesCollection(series31);
XYDataset dataset32 = new XYSeriesCollection(series32);
CombinedRangeXYPlot parent = new CombinedRangeXYPlot(new NumberAxis(""));
XYItemRenderer renderer1 = new StandardXYItemRenderer();
XYItemRenderer renderer2 = new StandardXYItemRenderer();
XYItemRenderer renderer3 = new StandardXYItemRenderer();
//LEFT
XYPlot subplot1 = new XYPlot(dataset30, null, new NumberAxis(null), renderer1);
NumberAxis axis1 = (NumberAxis) subplot1.getRangeAxis();
axis1.setTickLabelFont(new Font("Monospaced", Font.PLAIN, 11));
axis1.setLabelFont(new Font("SansSerif", Font.PLAIN, 11));
axis1.setAutoRangeIncludesZero(false);
parent.add(subplot1, 1);
//MIDDLE
XYPlot subplot2 = new XYPlot(dataset31, null, new NumberAxis(null), renderer2);
NumberAxis axis2 = (NumberAxis) subplot2.getRangeAxis();
axis2.setTickLabelFont(new Font("Monospaced", Font.PLAIN, 11));
axis2.setLabelFont(new Font("SansSerif", Font.PLAIN, 11));
axis2.setAutoRangeIncludesZero(false);
parent.add(subplot2, 1);
//RIGHT
XYPlot subplot3 = new XYPlot(dataset32, null, new NumberAxis(null), renderer2);
NumberAxis axis3 = (NumberAxis) subplot2.getRangeAxis();
axis3.setTickLabelFont(new Font("Monospaced", Font.PLAIN, 11));
axis3.setLabelFont(new Font("SansSerif", Font.PLAIN, 11));
axis3.setAutoRangeIncludesZero(false);
parent.add(subplot3, 1);
JFreeChart chart3 = new JFreeChart("Well Log", parent);
BufferedImage image3 = chart3.createBufferedImage(400, 500);
depthPlot.setIcon(new ImageIcon(image3));
}
//public void **END** Read records from file
//close file and terminate application
public void closeFile()
{
if(input!=null)
input.close(); // close file
}//end method closefile
}//Public Class MyFileClass *END**
//Public Class BinaryTree **START**
public class BinaryTree {
// Root node pointer. Will be null for an empty tree.
private Node root;
private class Node {
Node left;
Node right;
double data1;
double data2;
Node(double newData1, double newData2) {
left = null;
right = null;
data1 = newData1;
data2 = newData2;
}
}
//Creates an empty binary tree -- a null root pointer.
public void BinaryTree() {
root = null;
}
public int size() {
return(size(root));
}
private int size(Node node) {
if (node == null) return(0);
else {
return(size(node.left) + 1 + size(node.right));
}
}
//Inserts the given data into the binary tree. Uses a recursive helper.
public void insert(double data1, double data2) {
root = insert(root, data1, data2);
}
private Node insert(Node node, double data1, double data2) {
if (node==null) {
node = new Node(data1, data2);
}
else {
if (data2 <= node.data2) {
node.left = insert(node.left, data1, data2);
}
else {
node.right = insert(node.right, data1, data2);
}
}
return(node); // in any case, return the new pointer to the caller
}
//Recursive lookup -- given a node, recur down searching for the given data.
public void print_inorderg() {
print_inorderg(root);
System.out.println();
}
private void print_inorderg(Node node) {
if (node==null) return;
print_inorderg(node.left);
String aString1 = Double.toString(node.data2);
String aString2 = Double.toString(node.data1);
textAreaGamma.append(aString2 + "\t\t\t" + aString1 + "\n");
print_inorderg(node.right);
}
public void print_inorderp() {
print_inorderp(root);
System.out.println();
}
private void print_inorderp(Node node) {
if (node==null) return;
print_inorderp(node.left);
String aString1 = Double.toString(node.data2);
String aString2 = Double.toString(node.data1);
textAreaPorosity.append(aString2 + "\t\t\t" + aString1 + "\n");
print_inorderp(node.right);
}
public void print_inorderm() {
print_inorderm(root);
System.out.println();
}
private void print_inorderm(Node node) {
if (node==null) return;
print_inorderm(node.left);
String aString1 = Double.toString(node.data2);
String aString2 = Double.toString(node.data1);
textAreaPermeability.append(aString2 + "\t\t\t" + aString1 + "\n");
print_inorderm(node.right);
}
}
//Public Class BinaryTree **END**
/** This method is called from within the constructor to
* initialize the form.
* WARNING: Do NOT modify this code. The content of this method is
* always regenerated by the Form Editor.
*/
@SuppressWarnings("unchecked")
// <editor-fold defaultstate="collapsed" desc="Generated Code">
private void initComponents() {
jPanel1 = new javax.swing.JPanel();
jPanelMain = new javax.swing.JTabbedPane();
jPanel5 = new javax.swing.JPanel();
jScrollPane1 = new javax.swing.JScrollPane();
textarea = new javax.swing.JTextArea();
jPanel13 = new javax.swing.JPanel();
jPanel14 = new javax.swing.JPanel();
jScrollPane5 = new javax.swing.JScrollPane();
textAreaDepthView = new javax.swing.JTextArea();
jPanel15 = new javax.swing.JPanel();
depthPlot = new javax.swing.JLabel();
jPanel2 = new javax.swing.JPanel();
jPanel3 = new javax.swing.JPanel();
jScrollPane2 = new javax.swing.JScrollPane();
textAreaGamma = new javax.swing.JTextArea();
jPanel4 = new javax.swing.JPanel();
gammaPlot = new javax.swing.JLabel();
jPanel6 = new javax.swing.JPanel();
jPanel7 = new javax.swing.JPanel();
jScrollPane3 = new javax.swing.JScrollPane();
textAreaPorosity = new javax.swing.JTextArea();
jPanel8 = new javax.swing.JPanel();
porosityPlot = new javax.swing.JLabel();
jPanel9 = new javax.swing.JPanel();
jPanel10 = new javax.swing.JPanel();
jScrollPane4 = new javax.swing.JScrollPane();
textAreaPermeability = new javax.swing.JTextArea();
jPanel11 = new javax.swing.JPanel();
permeabilityPlot = new javax.swing.JLabel();
fileChooser = new javax.swing.JFileChooser();
jMenuBar1 = new javax.swing.JMenuBar();
jMenu1 = new javax.swing.JMenu();
Open = new javax.swing.JMenuItem();
Exit = new javax.swing.JMenuItem();
setDefaultCloseOperation(javax.swing.WindowConstants.EXIT_ON_CLOSE);
setTitle("Well Log Analyzer");
textarea.setColumns(20);
textarea.setRows(5);
jScrollPane1.setViewportView(textarea);
javax.swing.GroupLayout jPanel5Layout = new javax.swing.GroupLayout(jPanel5);
jPanel5.setLayout(jPanel5Layout);
jPanel5Layout.setHorizontalGroup(
jPanel5Layout.createParallelGroup(javax.swing.GroupLayout.Alignment.LEADING)
.addComponent(jScrollPane1, javax.swing.GroupLayout.DEFAULT_SIZE, 1018, Short.MAX_VALUE)
);
jPanel5Layout.setVerticalGroup(
jPanel5Layout.createParallelGroup(javax.swing.GroupLayout.Alignment.LEADING)
.addComponent(jScrollPane1, javax.swing.GroupLayout.DEFAULT_SIZE, 523, Short.MAX_VALUE)
);
jPanelMain.addTab("Preview Welllog", jPanel5);
textAreaDepthView.setColumns(20);
textAreaDepthView.setRows(5);
jScrollPane5.setViewportView(textAreaDepthView);
javax.swing.GroupLayout jPanel14Layout = new javax.swing.GroupLayout(jPanel14);
jPanel14.setLayout(jPanel14Layout);
jPanel14Layout.setHorizontalGroup(
jPanel14Layout.createParallelGroup(javax.swing.GroupLayout.Alignment.LEADING)
.addComponent(jScrollPane5, javax.swing.GroupLayout.DEFAULT_SIZE, 390, Short.MAX_VALUE)
);
jPanel14Layout.setVerticalGroup(
jPanel14Layout.createParallelGroup(javax.swing.GroupLayout.Alignment.LEADING)
.addComponent(jScrollPane5, javax.swing.GroupLayout.DEFAULT_SIZE, 501, Short.MAX_VALUE)
);
depthPlot.setText(" ");
javax.swing.GroupLayout jPanel15Layout = new javax.swing.GroupLayout(jPanel15);
jPanel15.setLayout(jPanel15Layout);
jPanel15Layout.setHorizontalGroup(
jPanel15Layout.createParallelGroup(javax.swing.GroupLayout.Alignment.LEADING)
.addComponent(depthPlot, javax.swing.GroupLayout.Alignment.TRAILING, javax.swing.GroupLayout.DEFAULT_SIZE, 590, Short.MAX_VALUE)
);
jPanel15Layout.setVerticalGroup(
jPanel15Layout.createParallelGroup(javax.swing.GroupLayout.Alignment.LEADING)
.addComponent(depthPlot, javax.swing.GroupLayout.DEFAULT_SIZE, 501, Short.MAX_VALUE)
);
javax.swing.GroupLayout jPanel13Layout = new javax.swing.GroupLayout(jPanel13);
jPanel13.setLayout(jPanel13Layout);
jPanel13Layout.setHorizontalGroup(
jPanel13Layout.createParallelGroup(javax.swing.GroupLayout.Alignment.LEADING)
.addGroup(jPanel13Layout.createSequentialGroup()
.addContainerGap()
.addComponent(jPanel14, javax.swing.GroupLayout.PREFERRED_SIZE, javax.swing.GroupLayout.DEFAULT_SIZE, javax.swing.GroupLayout.PREFERRED_SIZE)
.addGap(18, 18, 18)
.addComponent(jPanel15, javax.swing.GroupLayout.DEFAULT_SIZE, javax.swing.GroupLayout.DEFAULT_SIZE, Short.MAX_VALUE)
.addContainerGap())
);
jPanel13Layout.setVerticalGroup(
jPanel13Layout.createParallelGroup(javax.swing.GroupLayout.Alignment.LEADING)
.addGroup(javax.swing.GroupLayout.Alignment.TRAILING, jPanel13Layout.createSequentialGroup()
.addContainerGap()
.addGroup(jPanel13Layout.createParallelGroup(javax.swing.GroupLayout.Alignment.TRAILING)
.addComponent(jPanel15, javax.swing.GroupLayout.Alignment.LEADING, javax.swing.GroupLayout.DEFAULT_SIZE, javax.swing.GroupLayout.DEFAULT_SIZE, Short.MAX_VALUE)
.addComponent(jPanel14, javax.swing.GroupLayout.Alignment.LEADING, javax.swing.GroupLayout.DEFAULT_SIZE, javax.swing.GroupLayout.DEFAULT_SIZE, Short.MAX_VALUE))
.addContainerGap())
);
jPanelMain.addTab("Depth View", jPanel13);
textAreaGamma.setColumns(20);
textAreaGamma.setRows(5);
jScrollPane2.setViewportView(textAreaGamma);
javax.swing.GroupLayout jPanel3Layout = new javax.swing.GroupLayout(jPanel3);
jPanel3.setLayout(jPanel3Layout);
jPanel3Layout.setHorizontalGroup(
jPanel3Layout.createParallelGroup(javax.swing.GroupLayout.Alignment.LEADING)
.addGroup(jPanel3Layout.createSequentialGroup()
.addComponent(jScrollPane2, javax.swing.GroupLayout.DEFAULT_SIZE, 390, Short.MAX_VALUE)
.addContainerGap())
);
jPanel3Layout.setVerticalGroup(
jPanel3Layout.createParallelGroup(javax.swing.GroupLayout.Alignment.LEADING)
.addComponent(jScrollPane2, javax.swing.GroupLayout.DEFAULT_SIZE, 501, Short.MAX_VALUE)
);
gammaPlot.setText(" ");
javax.swing.GroupLayout jPanel4Layout = new javax.swing.GroupLayout(jPanel4);
jPanel4.setLayout(jPanel4Layout);
jPanel4Layout.setHorizontalGroup(
jPanel4Layout.createParallelGroup(javax.swing.GroupLayout.Alignment.LEADING)
.addComponent(gammaPlot, javax.swing.GroupLayout.Alignment.TRAILING, javax.swing.GroupLayout.DEFAULT_SIZE, 580, Short.MAX_VALUE)
);
jPanel4Layout.setVerticalGroup(
jPanel4Layout.createParallelGroup(javax.swing.GroupLayout.Alignment.LEADING)
.addComponent(gammaPlot, javax.swing.GroupLayout.Alignment.TRAILING, javax.swing.GroupLayout.DEFAULT_SIZE, 501, Short.MAX_VALUE)
);
javax.swing.GroupLayout jPanel2Layout = new javax.swing.GroupLayout(jPanel2);
jPanel2.setLayout(jPanel2Layout);
jPanel2Layout.setHorizontalGroup(
jPanel2Layout.createParallelGroup(javax.swing.GroupLayout.Alignment.LEADING)
.addGroup(jPanel2Layout.createSequentialGroup()
.addContainerGap()
.addComponent(jPanel3, javax.swing.GroupLayout.PREFERRED_SIZE, javax.swing.GroupLayout.DEFAULT_SIZE, javax.swing.GroupLayout.PREFERRED_SIZE)
.addGap(18, 18, 18)
.addComponent(jPanel4, javax.swing.GroupLayout.DEFAULT_SIZE, javax.swing.GroupLayout.DEFAULT_SIZE, Short.MAX_VALUE)
.addContainerGap())
);
jPanel2Layout.setVerticalGroup(
jPanel2Layout.createParallelGroup(javax.swing.GroupLayout.Alignment.LEADING)
.addGroup(jPanel2Layout.createSequentialGroup()
.addContainerGap()
.addGroup(jPanel2Layout.createParallelGroup(javax.swing.GroupLayout.Alignment.LEADING)
.addComponent(jPanel4, javax.swing.GroupLayout.Alignment.TRAILING, javax.swing.GroupLayout.DEFAULT_SIZE, javax.swing.GroupLayout.DEFAULT_SIZE, Short.MAX_VALUE)
.addComponent(jPanel3, javax.swing.GroupLayout.Alignment.TRAILING, javax.swing.GroupLayout.DEFAULT_SIZE, javax.swing.GroupLayout.DEFAULT_SIZE, Short.MAX_VALUE))
.addContainerGap())
);
jPanelMain.addTab("Gamma", jPanel2);
textAreaPorosity.setColumns(20);
textAreaPorosity.setRows(5);
jScrollPane3.setViewportView(textAreaPorosity);
javax.swing.GroupLayout jPanel7Layout = new javax.swing.GroupLayout(jPanel7);
jPanel7.setLayout(jPanel7Layout);
jPanel7Layout.setHorizontalGroup(
jPanel7Layout.createParallelGroup(javax.swing.GroupLayout.Alignment.LEADING)
.addGroup(jPanel7Layout.createSequentialGroup()
.addComponent(jScrollPane3, javax.swing.GroupLayout.PREFERRED_SIZE, 390, javax.swing.GroupLayout.PREFERRED_SIZE)
.addContainerGap(javax.swing.GroupLayout.DEFAULT_SIZE, Short.MAX_VALUE))
);
jPanel7Layout.setVerticalGroup(
jPanel7Layout.createParallelGroup(javax.swing.GroupLayout.Alignment.LEADING)
.addComponent(jScrollPane3, javax.swing.GroupLayout.DEFAULT_SIZE, 501, Short.MAX_VALUE)
);
porosityPlot.setText(" ");
javax.swing.GroupLayout jPanel8Layout = new javax.swing.GroupLayout(jPanel8);
jPanel8.setLayout(jPanel8Layout);
jPanel8Layout.setHorizontalGroup(
jPanel8Layout.createParallelGroup(javax.swing.GroupLayout.Alignment.LEADING)
.addGroup(jPanel8Layout.createSequentialGroup()
.addComponent(porosityPlot, javax.swing.GroupLayout.PREFERRED_SIZE, 578, javax.swing.GroupLayout.PREFERRED_SIZE)
.addContainerGap(javax.swing.GroupLayout.DEFAULT_SIZE, Short.MAX_VALUE))
);
jPanel8Layout.setVerticalGroup(
jPanel8Layout.createParallelGroup(javax.swing.GroupLayout.Alignment.LEADING)
.addComponent(porosityPlot, javax.swing.GroupLayout.DEFAULT_SIZE, 501, Short.MAX_VALUE)
);
javax.swing.GroupLayout jPanel6Layout = new javax.swing.GroupLayout(jPanel6);
jPanel6.setLayout(jPanel6Layout);
jPanel6Layout.setHorizontalGroup(
jPanel6Layout.createParallelGroup(javax.swing.GroupLayout.Alignment.LEADING)
.addGroup(jPanel6Layout.createSequentialGroup()
.addContainerGap()
.addComponent(jPanel7, javax.swing.GroupLayout.PREFERRED_SIZE, javax.swing.GroupLayout.DEFAULT_SIZE, javax.swing.GroupLayout.PREFERRED_SIZE)
.addGap(18, 18, 18)
.addComponent(jPanel8, javax.swing.GroupLayout.DEFAULT_SIZE, 580, Short.MAX_VALUE)
.addContainerGap())
);
jPanel6Layout.setVerticalGroup(
jPanel6Layout.createParallelGroup(javax.swing.GroupLayout.Alignment.LEADING)
.addGroup(javax.swing.GroupLayout.Alignment.TRAILING, jPanel6Layout.createSequentialGroup()
.addContainerGap()
.addGroup(jPanel6Layout.createParallelGroup(javax.swing.GroupLayout.Alignment.TRAILING)
.addComponent(jPanel8, javax.swing.GroupLayout.Alignment.LEADING, javax.swing.GroupLayout.DEFAULT_SIZE, javax.swing.GroupLayout.DEFAULT_SIZE, Short.MAX_VALUE)
.addComponent(jPanel7, javax.swing.GroupLayout.Alignment.LEADING, javax.swing.GroupLayout.DEFAULT_SIZE, javax.swing.GroupLayout.DEFAULT_SIZE, Short.MAX_VALUE))
.addContainerGap())
);
jPanelMain.addTab("Porosity", jPanel6);
textAreaPermeability.setColumns(20);
textAreaPermeability.setRows(5);
jScrollPane4.setViewportView(textAreaPermeability);
javax.swing.GroupLayout jPanel10Layout = new javax.swing.GroupLayout(jPanel10);
jPanel10.setLayout(jPanel10Layout);
jPanel10Layout.setHorizontalGroup(
jPanel10Layout.createParallelGroup(javax.swing.GroupLayout.Alignment.LEADING)
.addGroup(jPanel10Layout.createSequentialGroup()
.addComponent(jScrollPane4, javax.swing.GroupLayout.DEFAULT_SIZE, 390, Short.MAX_VALUE)
.addContainerGap())
);
jPanel10Layout.setVerticalGroup(
jPanel10Layout.createParallelGroup(javax.swing.GroupLayout.Alignment.LEADING)
.addComponent(jScrollPane4, javax.swing.GroupLayout.DEFAULT_SIZE, 501, Short.MAX_VALUE)
);
permeabilityPlot.setText(" ");
javax.swing.GroupLayout jPanel11Layout = new javax.swing.GroupLayout(jPanel11);
jPanel11.setLayout(jPanel11Layout);
jPanel11Layout.setHorizontalGroup(
jPanel11Layout.createParallelGroup(javax.swing.GroupLayout.Alignment.LEADING)
.addComponent(permeabilityPlot, javax.swing.GroupLayout.DEFAULT_SIZE, 570, Short.MAX_VALUE)
);
jPanel11Layout.setVerticalGroup(
jPanel11Layout.createParallelGroup(javax.swing.GroupLayout.Alignment.LEADING)
.addComponent(permeabilityPlot, javax.swing.GroupLayout.DEFAULT_SIZE, 501, Short.MAX_VALUE)
);
javax.swing.GroupLayout jPanel9Layout = new javax.swing.GroupLayout(jPanel9);
jPanel9.setLayout(jPanel9Layout);
jPanel9Layout.setHorizontalGroup(
jPanel9Layout.createParallelGroup(javax.swing.GroupLayout.Alignment.LEADING)
.addGroup(jPanel9Layout.createSequentialGroup()
.addContainerGap()
.addComponent(jPanel10, javax.swing.GroupLayout.PREFERRED_SIZE, javax.swing.GroupLayout.DEFAULT_SIZE, javax.swing.GroupLayout.PREFERRED_SIZE)
.addGap(18, 18, 18)
.addComponent(jPanel11, javax.swing.GroupLayout.PREFERRED_SIZE, javax.swing.GroupLayout.DEFAULT_SIZE, javax.swing.GroupLayout.PREFERRED_SIZE)
.addContainerGap(20, Short.MAX_VALUE))
);
jPanel9Layout.setVerticalGroup(
jPanel9Layout.createParallelGroup(javax.swing.GroupLayout.Alignment.LEADING)
.addGroup(javax.swing.GroupLayout.Alignment.TRAILING, jPanel9Layout.createSequentialGroup()
.addContainerGap()
.addGroup(jPanel9Layout.createParallelGroup(javax.swing.GroupLayout.Alignment.TRAILING)
.addComponent(jPanel11, javax.swing.GroupLayout.Alignment.LEADING, javax.swing.GroupLayout.DEFAULT_SIZE, javax.swing.GroupLayout.DEFAULT_SIZE, Short.MAX_VALUE)
.addComponent(jPanel10, javax.swing.GroupLayout.Alignment.LEADING, javax.swing.GroupLayout.DEFAULT_SIZE, javax.swing.GroupLayout.DEFAULT_SIZE, Short.MAX_VALUE))
.addContainerGap())
);
jPanelMain.addTab("Permeability", jPanel9);
fileChooser.setDialogTitle("Open File");
fileChooser.setFileFilter(new MyCustomFilter());
jPanelMain.addTab("Set Path", fileChooser);
javax.swing.GroupLayout jPanel1Layout = new javax.swing.GroupLayout(jPanel1);
jPanel1.setLayout(jPanel1Layout);
jPanel1Layout.setHorizontalGroup(
jPanel1Layout.createParallelGroup(javax.swing.GroupLayout.Alignment.LEADING)
.addGroup(jPanel1Layout.createSequentialGroup()
.addContainerGap()
.addComponent(jPanelMain, javax.swing.GroupLayout.PREFERRED_SIZE, 1023, javax.swing.GroupLayout.PREFERRED_SIZE)
.addContainerGap(29, Short.MAX_VALUE))
);
jPanel1Layout.setVerticalGroup(
jPanel1Layout.createParallelGroup(javax.swing.GroupLayout.Alignment.LEADING)
.addGroup(javax.swing.GroupLayout.Alignment.TRAILING, jPanel1Layout.createSequentialGroup()
.addContainerGap(javax.swing.GroupLayout.DEFAULT_SIZE, Short.MAX_VALUE)
.addComponent(jPanelMain, javax.swing.GroupLayout.PREFERRED_SIZE, 548, javax.swing.GroupLayout.PREFERRED_SIZE))
);
jMenu1.setText("File");
Open.setText("Open");
Open.addActionListener(new java.awt.event.ActionListener() {
public void actionPerformed(java.awt.event.ActionEvent evt) {
OpenActionPerformed(evt);
}
});
jMenu1.add(Open);
Exit.setText("Exit");
Exit.addActionListener(new java.awt.event.ActionListener() {
public void actionPerformed(java.awt.event.ActionEvent evt) {
ExitActionPerformed(evt);
}
});
jMenu1.add(Exit);
jMenuBar1.add(jMenu1);
setJMenuBar(jMenuBar1);
javax.swing.GroupLayout layout = new javax.swing.GroupLayout(getContentPane());
getContentPane().setLayout(layout);
layout.setHorizontalGroup(
layout.createParallelGroup(javax.swing.GroupLayout.Alignment.LEADING)
.addGroup(layout.createSequentialGroup()
.addComponent(jPanel1, javax.swing.GroupLayout.PREFERRED_SIZE, javax.swing.GroupLayout.DEFAULT_SIZE, javax.swing.GroupLayout.PREFERRED_SIZE)
.addContainerGap(javax.swing.GroupLayout.DEFAULT_SIZE, Short.MAX_VALUE))
);
layout.setVerticalGroup(
layout.createParallelGroup(javax.swing.GroupLayout.Alignment.LEADING)
.addComponent(jPanel1, javax.swing.GroupLayout.DEFAULT_SIZE, javax.swing.GroupLayout.DEFAULT_SIZE, Short.MAX_VALUE)
);
pack();
}// </editor-fold>
private void ExitActionPerformed(java.awt.event.ActionEvent evt) {
// Exit from Application
System.exit(0);
}
private void OpenActionPerformed(java.awt.event.ActionEvent evt) {
int returnVal = fileChooser.showOpenDialog(this);
if (returnVal == JFileChooser.APPROVE_OPTION) {
File file = fileChooser.getSelectedFile();
try {
//Sending Path To Input File
MyFileClass file1 = new MyFileClass();
file1.setPathString(file.getAbsolutePath());
file1.inputFile();
file1.readLog();
file1.closeFile();
// Display it in a TextArea to Preview Well Log
textarea.read(new FileReader(file.getAbsolutePath()), null);
} catch (IOException ex) {
System.out.println("problem accessing file" + file.getAbsolutePath());
}
} else {
System.out.println("File access cancelled by user.");
}
}
/**
* @param args the command line arguments
*/
public static void main(String args[]) {
try {
UIManager.setLookAndFeel(UIManager.getSystemLookAndFeelClassName());
} catch (Exception e) { }
java.awt.EventQueue.invokeLater(new Runnable() {
public void run() {
new WellLogAnalyzer().setVisible(true);
}
});
}
// Variables declaration - do not modify
private javax.swing.JMenuItem Exit;
private javax.swing.JMenuItem Open;
private javax.swing.JLabel depthPlot;
private javax.swing.JFileChooser fileChooser;
private javax.swing.JLabel gammaPlot;
private javax.swing.JMenu jMenu1;
private javax.swing.JMenuBar jMenuBar1;
private javax.swing.JPanel jPanel1;
private javax.swing.JPanel jPanel10;
private javax.swing.JPanel jPanel11;
private javax.swing.JPanel jPanel13;
private javax.swing.JPanel jPanel14;
private javax.swing.JPanel jPanel15;
private javax.swing.JPanel jPanel2;
private javax.swing.JPanel jPanel3;
private javax.swing.JPanel jPanel4;
private javax.swing.JPanel jPanel5;
private javax.swing.JPanel jPanel6;
private javax.swing.JPanel jPanel7;
private javax.swing.JPanel jPanel8;
private javax.swing.JPanel jPanel9;
private javax.swing.JTabbedPane jPanelMain;
private javax.swing.JScrollPane jScrollPane1;
private javax.swing.JScrollPane jScrollPane2;
private javax.swing.JScrollPane jScrollPane3;
private javax.swing.JScrollPane jScrollPane4;
private javax.swing.JScrollPane jScrollPane5;
private javax.swing.JLabel permeabilityPlot;
private javax.swing.JLabel porosityPlot;
private javax.swing.JTextArea textAreaDepthView;
private javax.swing.JTextArea textAreaGamma;
private javax.swing.JTextArea textAreaPermeability;
private javax.swing.JTextArea textAreaPorosity;
private javax.swing.JTextArea textarea;
// End of variables declaration
}
Renamed welllog.txt to wellog.las
and tried to open (File open) - got: File improperly formed
and tried to open (File open) - got: File improperly formed
ASKER
Sorry about that. Just delete the top line from the welllog file. I meant to take off the headers.
OK, it works now.
ASKER CERTIFIED SOLUTION
membership
This solution is only available to members.
To access this solution, you must be a member of Experts Exchange.
ASKER
Thank you for your help again this works just as I want it to. I was working on trying to figure out how to get this to work for hours yesterday.
JFreeChart was definitely the best way to go. I had some trouble installing it but after I finally got it installed it was well worth it because the graphs are of excellent quality. Since, I will continue producing plots it is worth learning how to use JFreeChart.
BTW: The reason I had the series swapped was because I noticed that the axis were not showing the way I wanted it to until I swapped them in the series. I don't know if its the correct way to do it though but it since it got me closer to what I was looking to achieve (depth on the vertical axis) I just continued with it that way.
But it is still seems to be not in the right orienation?
I agree, it is worth reading a bit about their logic - this axis, value axis, all this stuff.
I'm sure if I studied it at some point a little bit I would not have
been wandering around for so long.
I still could not figure out why automatic range still want to include zero, but eventually
understood how to make range non-automatic - that was not immediate either.
So you can just determine min and max, instead of hardcoding it as I did, and use it like that.
Eventually we would probably understand why it wants to go all the wy to zero, even
though the data are in a range between 6900 and 7500.
ASKER
Yes it's in the right orientation. The orientation I was trying to avoid was where the depth was on the horizontal axis. Also, I placed a negative value on all the depths to reverse the values so that it as the depth gets higher the well depth gets deeper.
I am still studying the JFreeChart to determine to play around with the settings. I am writing a similar program that plots as well except this one has two series in one chart.
I don't understand the autoranges either but I am still trying to figure it out.
I am still studying the JFreeChart to determine to play around with the settings. I am writing a similar program that plots as well except this one has two series in one chart.
I don't understand the autoranges either but I am still trying to figure it out.
Correct?