Grid with colored columns
hi guys
I have a requirment where i need to come up with a grid on a screen where when user selects
data on first column, the related data on other columns needs to be highlighted.
from the image
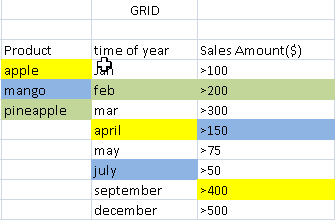
When user clicks on apple, it should be highlighted in yellow and
its corresponding data in other columns should also be highlighted in yellow.
Similarly with Mango and PineApple.
Is there any grid in Ext-js 4.2 which i can use to support this feature?
Thanks.
I have a requirment where i need to come up with a grid on a screen where when user selects
data on first column, the related data on other columns needs to be highlighted.
from the image
When user clicks on apple, it should be highlighted in yellow and
its corresponding data in other columns should also be highlighted in yellow.
Similarly with Mango and PineApple.
Is there any grid in Ext-js 4.2 which i can use to support this feature?
Thanks.
try using renderer property.
ASKER
renderer can get little complex, there are more than 100 products in my grid.
could you provide a SIMPLE and sample data? Thanks.
ASKER
Sure
we have backend in java which will return json data
so we will have something like
and for the above data the grid will be displayed
we have backend in java which will return json data
so we will have something like
{
    "total": 3,
    "data": [
        {
            "product": "apple",
            "timeOfYear": "april",
            "salesAmount": ">400"
        },
        {
            "product": "mango",
            "timeOfYear": "july",
            "salesAmount": ">150"
        },
        {
             "product": "pineapple",
            "timeOfYear": "feb",
            "salesAmount": ">200"
        },
       {
             "product": "grapes",
            "timeOfYear": "feb",
            "salesAmount": ">150"
        }

    ],
    "success": true,
    "serverMessage": null
}and for the above data the grid will be displayed
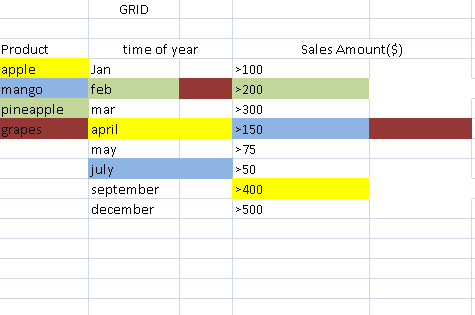
where do come from the right color?
ASKER
it can be any color (in random) but each selected product has unique color to differentiate from the rest.
so what about a renderer for each column like this one :
listen for cell click for your grid :
and you create a function getRandomColor to return a random color
function rndr(value, meta) {
        meta.tdCls = meta.record.data.product + "-color";
        return value;
}listen for cell click for your grid :
    listeners: {
        cellclick: function(cell, td, cellIndex, record, tr, rowIndex, e, eOpts ) {
            var cells = Ext.query("."+record.data.product + "-color");
            for(i=0;i<cells.length;i++) {
                cells[i].style.backgroundColor = getRandomColor();
            }
        }
}and you create a function getRandomColor to return a random color
ASKER
tested it in fiddle by hardcoding the color to red..
cant seem to make it work.
Can you tell me what is wrong..
Thanks very much.
Ext.create('Ext.data.Store', {
    storeId:'productStore',
    fields:['product','timeOfYear', 'salesAmount'],
    groupField: 'department',
    data:[
        {product:"apple", timeOfYear:"april", salesAmount:">400"},
        {product:"mango", timeOfYear:"july", salesAmount:">150"},
        {product:"pineapple", timeOfYear:"feb", salesAmount:">200"},
        {product:"grapes", timeOfYear:"feb", salesAmount:">150"}

    ]
});


function productRndr(value, meta) {
        meta.tdCls = meta.record.data.product + "-color";
        return value;
}

function timeRndr(value, meta) {
        meta.tdCls = meta.record.data.timeOfYear + "-color";
        return value;
}

function salesRndr(value, meta) {
        meta.tdCls = meta.record.data.salesAmount + "-color";
        return value;
}


Ext.create('Ext.form.Panel',{
    layout : {
		type : 'hbox',
		align: 'left',
		pack: 'center'

	},
    items: [
	{
        id:'myGrid',
        xtype : 'grid',
        title: 'Product / Time/ Sales Analysis',
        store: Ext.data.StoreManager.lookup('productStore'),
        autoHeight: true,
        columns: [
            {header: "Product", width: 79, dataIndex: 'product', renderer:productRndr,
            listeners: {
				cellclick: function(cell, td, cellIndex, record, tr, rowIndex, e, eOpts ) {
				var cells = Ext.query("."+record.data.product + "-color");
				for(i=0;i<cells.length;i++) {
                cells[i].style.backgroundColor = 'red';
					}
				}
			}},
            {header: "Time", width: 100, dataIndex: 'timeOfYear', renderer: timeRndr, sortable: true


			},
            {header: "Sales Amount", width: 100, dataIndex: 'salesAmount', sortable: true,renderer:salesRndr},


        ],


    height:410,
    //width:400,
    // split: true,
    // region: 'south',
    renderTo: Ext.getBody() //Ext.getBody()
	}

    ]
    }

)cant seem to make it work.
Can you tell me what is wrong..
Thanks very much.
check here t osee the difference : http://jsfiddle.net/of0ntLhu/3/
ASKER
ok thanks.
I took your code and replaced 'red' with random color generator using:
'#' + Math.random().toString(16)
But when i click on apple, i see 3 different colors.
Any clue
I took your code and replaced 'red' with random color generator using:
'#' + Math.random().toString(16)
Ext.create('Ext.data.Store', {
    storeId:'productStore',
    fields:['product','timeOfYear', 'salesAmount'],
    groupField: 'department',
    data:[
        {product:"apple", timeOfYear:"april", salesAmount:">400"},
        {product:"mango", timeOfYear:"july", salesAmount:">150"},
        {product:"pineapple", timeOfYear:"feb", salesAmount:">200"},
        {product:"grapes", timeOfYear:"feb", salesAmount:">150"}

    ]
});


function productRndr(value, meta) {
        meta.tdCls = meta.record.data.product + "-color";
        return value;
}

function timeRndr(value, meta) {
        meta.tdCls = meta.record.data.product + "-color";
        return value;
}

function salesRndr(value, meta) {
        meta.tdCls = meta.record.data.product + "-color";
        return value;
}


Ext.create('Ext.form.Panel',{
    layout : {
		type : 'hbox',
		align: 'left',
		pack: 'center'

	},
    items: [
	{
        id:'myGrid',
        xtype : 'grid',
        title: 'Product / Time/ Sales Analysis',
        store: Ext.data.StoreManager.lookup('productStore'),
        autoHeight: true,
        columns: [
            {header: "Product", width: 79, dataIndex: 'product', renderer:productRndr},
            {header: "Time", width: 100, dataIndex: 'timeOfYear', renderer: timeRndr, sortable: true },
            {header: "Sales Amount", width: 100, dataIndex: 'salesAmount', sortable: true,renderer:salesRndr}
        ],
    height:410,
    //width:400,
    // split: true,
    // region: 'south',
    renderTo: Ext.getBody(), //Ext.getBody()


    listeners: {
				cellclick: function(cell, td, cellIndex, record, tr, rowIndex, e, eOpts ) {
				var cells = Ext.query("."+record.data.product + "-color");
				for(i=0;i<cells.length;i++) {
                cells[i].style.backgroundColor = '#' + Math.random().toString(16).slice(2, 8);
					}
				}
			}	}
    ]
    }

)But when i click on apple, i see 3 different colors.
Any clue
ASKER CERTIFIED SOLUTION
membership
This solution is only available to members.
To access this solution, you must be a member of Experts Exchange.
ASKER
Thanks.
What i have done now is
I have taken uniique set of products, unique set of Time, unique set of Salesamount.
so from unique set of Time, feb is eliminated
from unique set of sales amount >150 is eliminated
This is the code (tested in fiddle)
Now when apple is clicked i see the first row selected
Now when mango is clicked i see the second row selected
Now when pineapple is clicked i see the third row selected
When grapes is clicked
{product:"grapes", timeOfYear:"feb", salesAmount:">150"}
I want to show something like

Is there any way i can fill a grid cell with two colors
For example
cell with 'feb' has two colors (one for pineapple and one for grapes)
cell with '>150' has two colors (one for mango and one for grapes)
Thanks.
What i have done now is
I have taken uniique set of products, unique set of Time, unique set of Salesamount.
so from unique set of Time, feb is eliminated
from unique set of sales amount >150 is eliminated
This is the code (tested in fiddle)
Ext.create('Ext.data.Store', {
    storeId:'productStore',
    fields:['product','timeOfYear', 'salesAmount'],
    groupField: 'department',
    data:[
        {product:"apple", timeOfYear:"april", salesAmount:">400"},
        {product:"mango", timeOfYear:"july", salesAmount:">150"},
        {product:"pineapple", timeOfYear:"feb", salesAmount:">200"},
        {product:"grapes", timeOfYear:"feb", salesAmount:">150"}

    ]
});


var colors = {};
function getColor(product) {//make a new color for every product and return that
    if(colors[product])
    return colors[product];
    colors[product] = '#' + Math.random().toString(16).slice(2, 8);
    return colors[product];
}


function productRndr(value, meta) {
        meta.tdCls = meta.record.data.product + "-color";
        return value;
}

var maco = {};
function timeRndr(value, meta) {
    if( !maco[value] ) {  // check if it already exists (return null if not)
        maco[value] = true;
        meta.tdCls = meta.record.data.product + "-color";
        return value;
    }
    else {
        return  '';
    }
}


var maco1 = {};
function salesRndr(value, meta) {
        if( !maco1[value] ) {  // check if it already exists (return null if not)
        maco1[value] = true;
        meta.tdCls = meta.record.data.product + "-color";
        return value;
    }
    else {
        return  '';
    }


}


Ext.create('Ext.form.Panel',{
    layout : {
		type : 'hbox',
		align: 'left',
		pack: 'center'

	},
    items: [
	{
        id:'myGrid',
        xtype : 'grid',
        title: 'Product / Time/ Sales Analysis',
        store: Ext.data.StoreManager.lookup('productStore'),
        autoHeight: true,
        columns: [
            {header: "Product", width: 79, dataIndex: 'product', renderer:productRndr},
            {header: "Time", width: 100, dataIndex: 'timeOfYear', renderer: timeRndr, sortable: true },
            {header: "Sales Amount", width: 100, dataIndex: 'salesAmount', sortable: true,renderer:salesRndr}
        ],
    height:410,
    //width:400,
    // split: true,
    // region: 'south',
    renderTo: Ext.getBody(), //Ext.getBody()


    listeners: {
				cellclick: function(cell, td, cellIndex, record, tr, rowIndex, e, eOpts ) {
				var cells = Ext.query("."+record.data.product + "-color");
				//alert(cells);
                for(i=0;i<cells.length;i++) {
                //cells[i].style.backgroundColor = '#' + Math.random().toString(16).slice(2, 8);
                cells[i].style.backgroundColor = getColor(record.data.product);

					}
				}
			}	}
    ]
    }

)Now when apple is clicked i see the first row selected
Now when mango is clicked i see the second row selected
Now when pineapple is clicked i see the third row selected
When grapes is clicked
{product:"grapes", timeOfYear:"feb", salesAmount:">150"}
I want to show something like
Is there any way i can fill a grid cell with two colors
For example
cell with 'feb' has two colors (one for pineapple and one for grapes)
cell with '>150' has two colors (one for mango and one for grapes)
Thanks.
I don't see any way to do that
ASKER
ok thanks.
ASKER
any help with my next question will be greatly appreciated
https://www.experts-exchange.com/questions/28511714/aligning-buttons-next-to-combo-box.html
Thanks.
https://www.experts-exchange.com/questions/28511714/aligning-buttons-next-to-combo-box.html
Thanks.