HOW TO: Performance Monitor vSphere 4.x or 5.0

Andrew Hancock (VMware vExpert PRO / EE Fellow/British Beekeeper)![]() VMware and Virtualization Consultant
VMware and Virtualization Consultant
 VMware and Virtualization Consultant
CERTIFIED EXPERT
EE Fellow, MVE, Expert of the Year 2021,2017-11, Scribe 2016-2012, Author of the Year 2018-6,2013-2012 VMware vExpert Pro, vExpert 2022-2011
Published:
Browse All Articles > HOW TO: Performance Monitor vSphere 4.x or 5.0
Got a vSphere 4.x or vSphere 5.0 performance issue? Read on
Got a vSphere 4.x or vSphere 5.0 performance issue? Read on
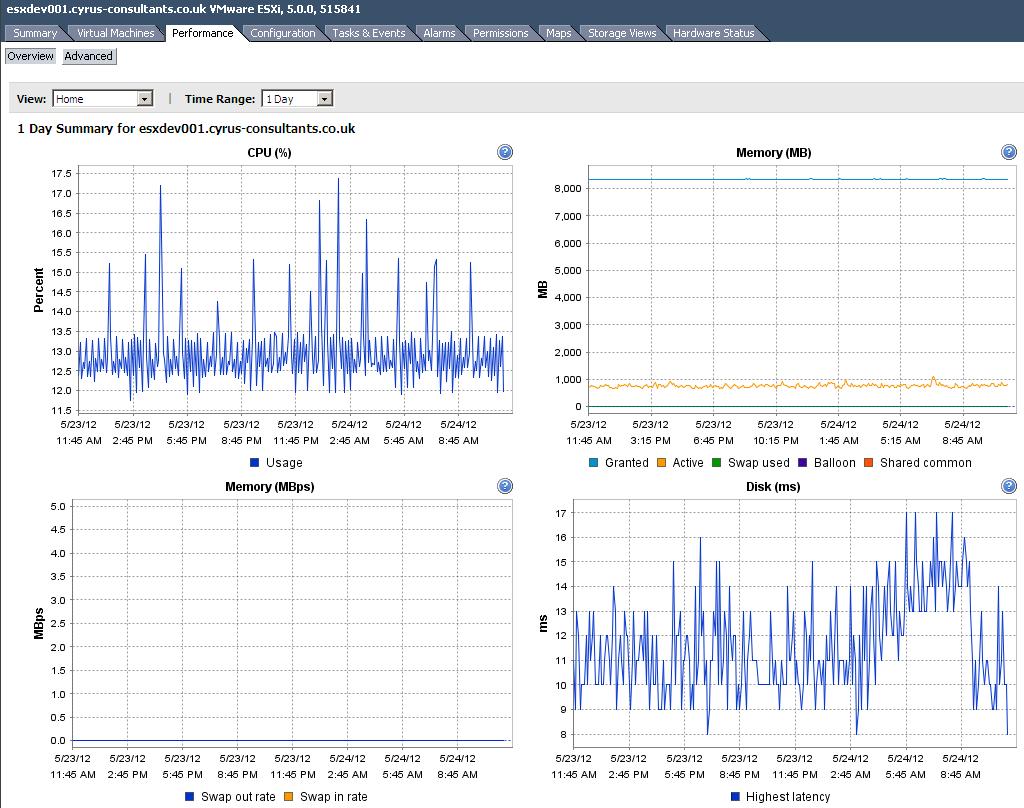
All the performance information for your vSphere 4.x or 5.0 environment is available from within vSphere vCenter, most performance monitoring tools, just present the information differently, the performance information has been obtained from vCenter Server monitoring your environment.
A free application that can help you display and present the information.
Veeam Monitor for free
If you want a quick tool, to help you with wanting to know all the individual elements, then I would suggest using Veeam Monitor Free Edition
Veeam Monitor leverages Veeam Business View™ to enable performance monitoring, alerting and reporting for virtual machine groups based on criteria such as business unit, department, location, purpose, service-level agreement or any other criteria you define. This ability to perform business-centric monitoring helps to identify the business impact of a virtual infrastructure’s performance and respond accordingly. It also allows you to configure flexible alerts based on known server type characteristics and the potential business impact of an outage for more granular service-level management. You can also create targeted reports showing only the data relevant to specific business units, departments or types of server.
Source
http://www.veeam.com/esxi-monitoring-free.html.
If you want to get down and dirty with the servers, then I would recommend the following documents
Performance Monitoring and Analysis
Guest-based performance monitoring is an inaccurate and unhelpful means of evaluating performance in virtual deployments. See Guest-based Performance Measurement for more inforamtion. Monitoring and analysis of VMware ESX Server should be performed with esxtop and VirtualCenter.
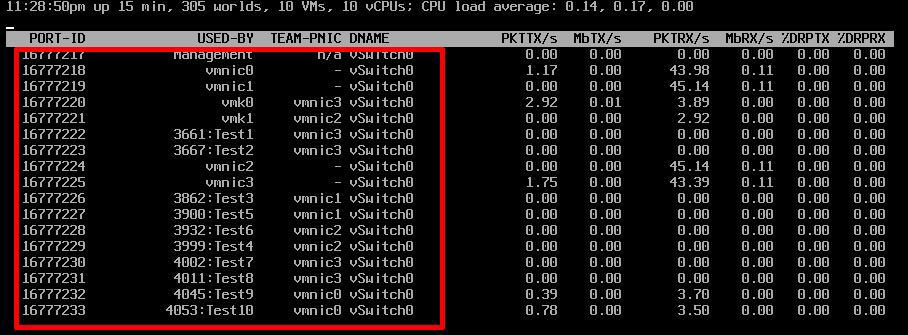
esxtop is the tried-and-true means of collecting every performance stat needed and making it available in a way that is conducive to analysis. The best source of information on launching esxtop can be found in the Resource Management Guide (page 159).
1. Check and correct CPU utilization: CPU Performance Analysis and Monitoring
2. Identify memory bottlenecks and remove: Memory Performance Analysis and Monitoring
3. Characterize storage performance and correct: Storage Performance Analysis and Monitoring
4. Understand and improve the network utilization profile: Network Performance Analysis and Monitoring
Within each of these articles are techniques for using counters from VirtualCenter and esxtop. Information on those counters is provided in
vCenter Performance Counters
esxtop Performance Counters
Also, note that, while useless in collecting performance data, Perfmon can help with analysis of large esxtop output files.
Using Perfmon for esxtop-based Performance Analysis
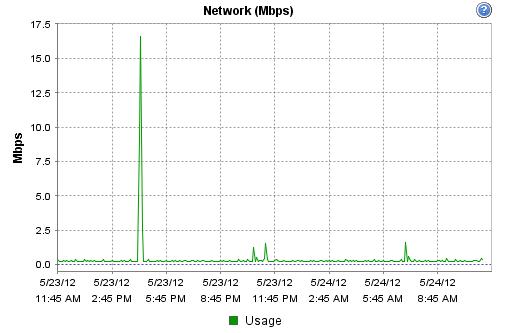
The vSphere Client can indicate that VM network traffic is causing a 1 GB Ethernet adapter to have a 99% utilization rate. But strangely, it doesn't display which kind of traffic is going across the virtual networks, where it came from or where it's going.
To learn which traffic is going across a virtual network, there's another free tool for vSphere: Xangati for ESX, a virtual appliance that tracks conversations on the virtual network. It's great for troubleshooting any virtual network issue, analyzing virtual desktop infrastructure and correlating vCenter performance stats with virtual network stats.
http://xangati.com/try-it-free/ (free)
*******************************************************************************************************************************************
Thank you for reading my article, please leave valuable feedback. If you liked my VMware article and would like to see more VMware Articles from me, please click the Yes button near the: Was this article helpful? at the Top of this article to the right of the Article title. Thank You.
*******************************************************************************************************************************************
All the performance information for your vSphere 4.x or 5.0 environment is available from within vSphere vCenter, most performance monitoring tools, just present the information differently, the performance information has been obtained from vCenter Server monitoring your environment.
A free application that can help you display and present the information.
Veeam Monitor for free
If you want a quick tool, to help you with wanting to know all the individual elements, then I would suggest using Veeam Monitor Free Edition
Veeam Monitor leverages Veeam Business View™ to enable performance monitoring, alerting and reporting for virtual machine groups based on criteria such as business unit, department, location, purpose, service-level agreement or any other criteria you define. This ability to perform business-centric monitoring helps to identify the business impact of a virtual infrastructure’s performance and respond accordingly. It also allows you to configure flexible alerts based on known server type characteristics and the potential business impact of an outage for more granular service-level management. You can also create targeted reports showing only the data relevant to specific business units, departments or types of server.
Source
http://www.veeam.com/esxi-monitoring-free.html.
If you want to get down and dirty with the servers, then I would recommend the following documents
Performance Monitoring and Analysis
Guest-based performance monitoring is an inaccurate and unhelpful means of evaluating performance in virtual deployments. See Guest-based Performance Measurement for more inforamtion. Monitoring and analysis of VMware ESX Server should be performed with esxtop and VirtualCenter.
esxtop is the tried-and-true means of collecting every performance stat needed and making it available in a way that is conducive to analysis. The best source of information on launching esxtop can be found in the Resource Management Guide (page 159).
1. Check and correct CPU utilization: CPU Performance Analysis and Monitoring
2. Identify memory bottlenecks and remove: Memory Performance Analysis and Monitoring
3. Characterize storage performance and correct: Storage Performance Analysis and Monitoring
4. Understand and improve the network utilization profile: Network Performance Analysis and Monitoring
Within each of these articles are techniques for using counters from VirtualCenter and esxtop. Information on those counters is provided in
vCenter Performance Counters
esxtop Performance Counters
Also, note that, while useless in collecting performance data, Perfmon can help with analysis of large esxtop output files.
Using Perfmon for esxtop-based Performance Analysis
The vSphere Client can indicate that VM network traffic is causing a 1 GB Ethernet adapter to have a 99% utilization rate. But strangely, it doesn't display which kind of traffic is going across the virtual networks, where it came from or where it's going.
To learn which traffic is going across a virtual network, there's another free tool for vSphere: Xangati for ESX, a virtual appliance that tracks conversations on the virtual network. It's great for troubleshooting any virtual network issue, analyzing virtual desktop infrastructure and correlating vCenter performance stats with virtual network stats.
http://xangati.com/try-it-free/ (free)
*******************************************************************************************************************************************
Thank you for reading my article, please leave valuable feedback. If you liked my VMware article and would like to see more VMware Articles from me, please click the Yes button near the: Was this article helpful? at the Top of this article to the right of the Article title. Thank You.
*******************************************************************************************************************************************
EE Fellow, MVE, Expert of the Year 2021,2017-11, Scribe 2016-2012, Author of the Year 2018-6,2013-2012 VMware vExpert Pro, vExpert 2022-2011
Have a question about something in this article? You can receive help directly from the article author. Sign up for a free trial to get started.
Comments (24)
Commented:
Commented:
Author
Commented:Commented:
Author
Commented:View More