amtechies
asked on
Setting XAxis labels in a Telerik RadChart Programmatically
This isn't necessarily a "hard" question, yet it's something that I need to figure out before it gets crazy late. And, since the telerik forums are usually slow to respond, I'm hoping Experts Exchange can get it solved quicker.
Alright, so I'm attempting to build something similar to their Grid with Chart in TemplateColumn demo. I've got the grid setup just fine, but I'm running into issues with their chart.
On radGridSales_OnItemDataBou
When I view the chart, this is what I get:
But, when the code behind is just:
I get the desired result, with the xaxis having the names.
The reason why I'd prefer to create it programmatically is because I can setup more useful tool tips. Now, if you know how to setup the tool tips another way and get the same desired result... then I'm all ears.
I sincerely appreciate your help & guidance!
- Andrew
PS: I'm a newbie and tried to assign more than 500 points, but was denied... but that's how much I'd like to get this figured out!
Alright, so I'm attempting to build something similar to their Grid with Chart in TemplateColumn demo. I've got the grid setup just fine, but I'm running into issues with their chart.
On radGridSales_OnItemDataBou
if (e.Item is GridDataItem)
            {
                var item = (GridDataItem)e.Item;
                var chart = (RadChart)item["ChartColumn"].FindControl("radSalesSurgeon");
                chart.Clear();

                var chartSeries = new ChartSeries
                                      {
                                          Name = "TotalSales",
                                          Type = ChartSeriesType.Bar,
                                          YAxisType = ChartYAxisType.Primary
                                      };

                var tempdt = SPs.RptTotalSalesBySurgeon(Convert.ToString(item.GetDataKeyValue("LocationID")), "%").GetReader();

                while (tempdt.Read())
                {
                    // Set value and value text
                    var chartSeriesItem = new ChartSeriesItem(Convert.ToDouble(tempdt.GetValue(2)),
                                                              tempdt.GetValue(1).ToString())
                                              {
                                                  Name = tempdt.GetValue(1).ToString(),

                                              };

                    chartSeriesItem.Label.Visible = false;
                    var itemTooltip = string.Format("<b>{0}</b><br />Total Sales: {1:C}", tempdt.GetValue(1), tempdt.GetValue(2));
                    chartSeriesItem.Label.ActiveRegion.Tooltip = itemTooltip;
                    chartSeriesItem.ActiveRegion.Tooltip = itemTooltip;
                    chartSeries.AddItem(chartSeriesItem);
                }
                chart.Series.Add(chartSeries);

                chart.PlotArea.XAxis.DataLabelsColumn = "Surgeon";
                chart.PlotArea.XAxis.IsZeroBased = true;
                chart.PlotArea.XAxis.AutoShrink = false;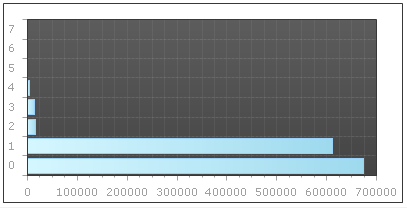
}When I view the chart, this is what I get:
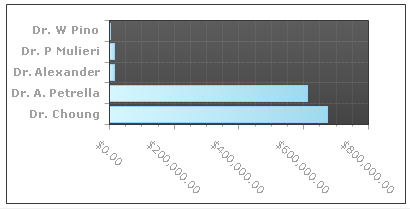
But, when the code behind is just:
var item = (GridDataItem)e.Item;
var chart = (RadChart)item["ChartColumn"].FindControl("radSalesSurgeon");

var tempdt = SPs.RptTotalSalesBySurgeon(Convert.ToString(item.GetDataKeyValue("LocationID")), "%").GetDataSet().Tables[0];
chart.DataSource = tempdt;
chart.DataBind();I get the desired result, with the xaxis having the names.
The reason why I'd prefer to create it programmatically is because I can setup more useful tool tips. Now, if you know how to setup the tool tips another way and get the same desired result... then I'm all ears.
I sincerely appreciate your help & guidance!
- Andrew
PS: I'm a newbie and tried to assign more than 500 points, but was denied... but that's how much I'd like to get this figured out!
ASKER CERTIFIED SOLUTION
membership
This solution is only available to members.
To access this solution, you must be a member of Experts Exchange.