Creating an Animated Progress Bar in Axure

Published:
Browse All Articles > Creating an Animated Progress Bar in Axure
Introduction
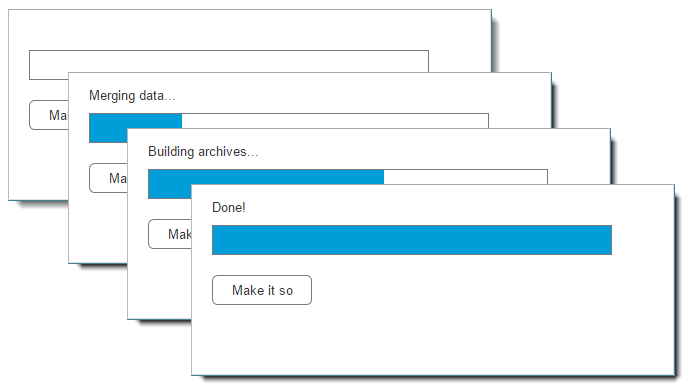
In this tutorial, I'll explain how to create an animated progress meter in a wireframe prototype developed using Axure RP 7.0 - a leading prototyping tool for designing web sites and software. (For more information about Axure and getting started with it, check out: https://www.experts-exchange.com/Web_Development/Software/A_17344-Setting-Up-Basic-Interactions-in-Axure.html)Here's a sneak preview of what you'll be building:
Please note that this tutorial does require the use of Axure 7.0 or later, which introduced the "Set Panel Size" action that the method used here relies upon.
Part 1: Creating the Basic Wireframe
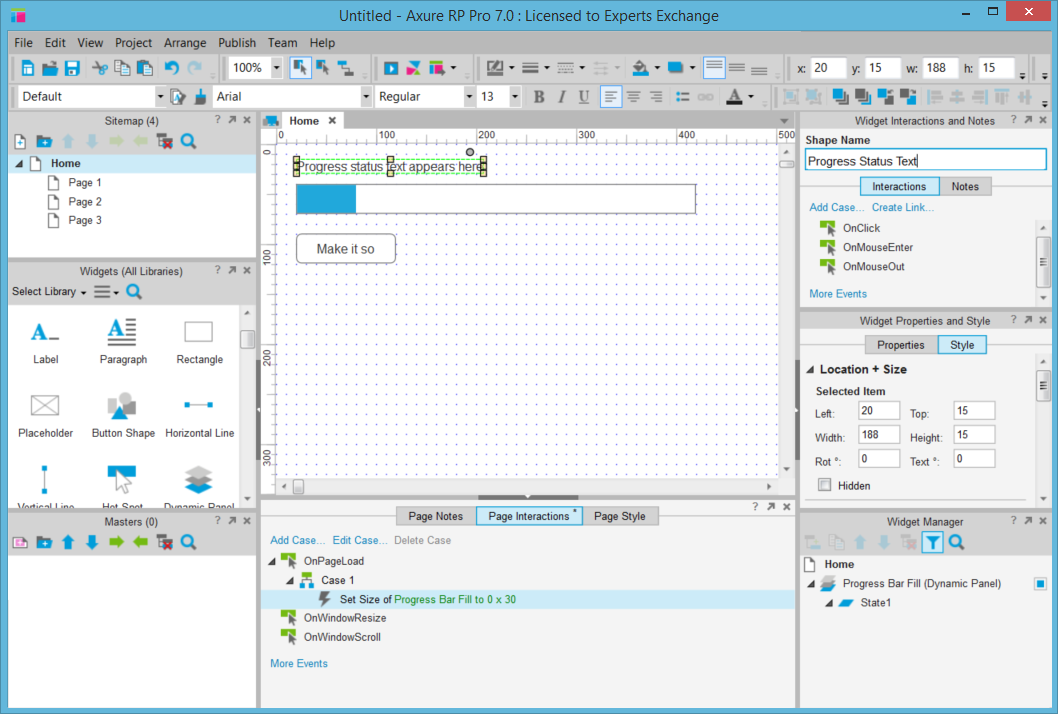
1.) Add a rectangle to the page and resize it to be the full shape of the progress bar. This will act as the outline of the meter. (Take note of the width of this rectangle, you'll need to know it later on. I set mine to 400 pixels.)
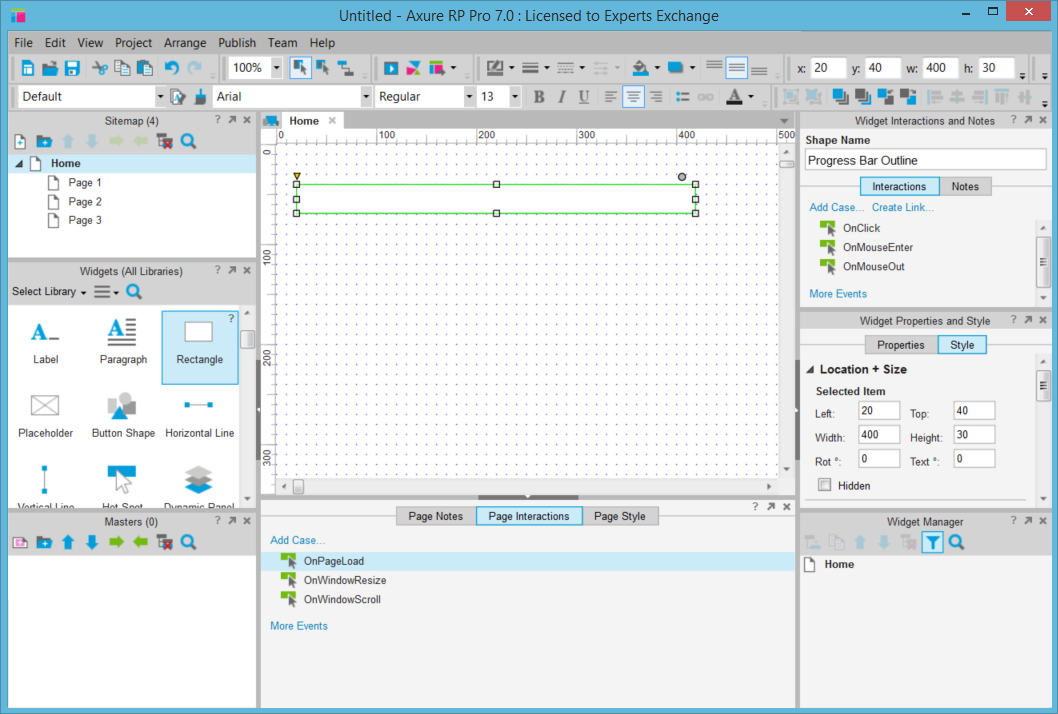
Protip: I highly recommend giving descriptive names to all the objects you create in any Axure prototype. While it doesn't matter much in a page with very few objects, these things quickly pile up and when you're setting up actions, figuring out which object in your list to perform the action on is really difficult if nothing has a label! You do this by entering a value in the Name field of the Widget Interactions and Notes pane for each object.
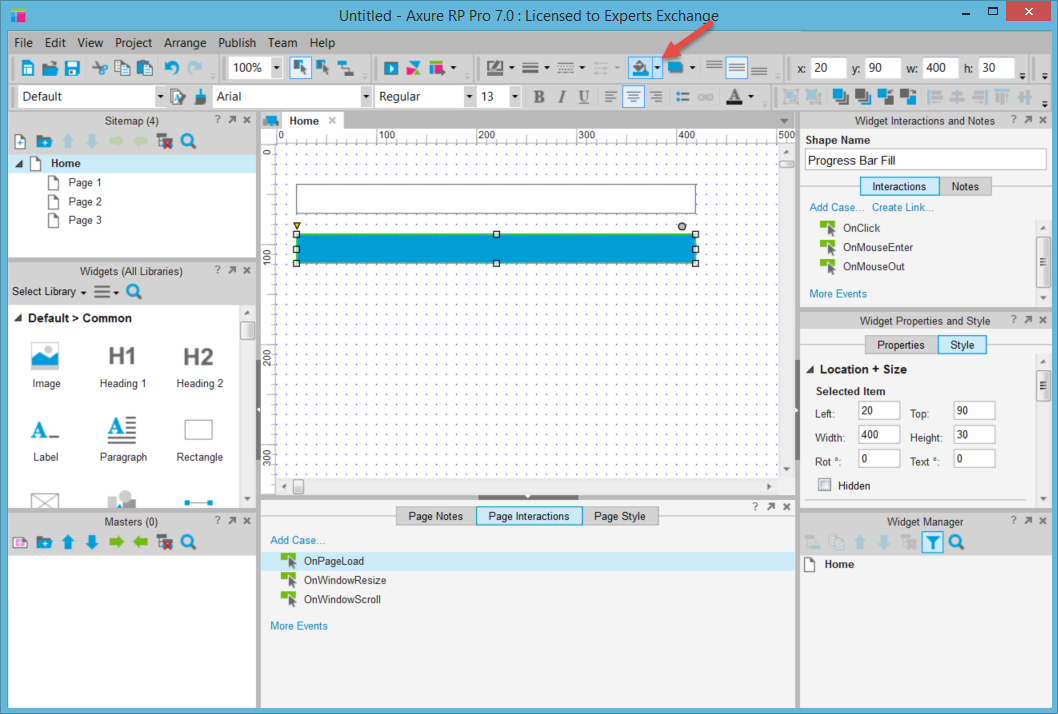
2.) Duplicate the rectangle created in Step 1, but give it a color fill. This rectangle will act as the filled-in portion of the progress bar.
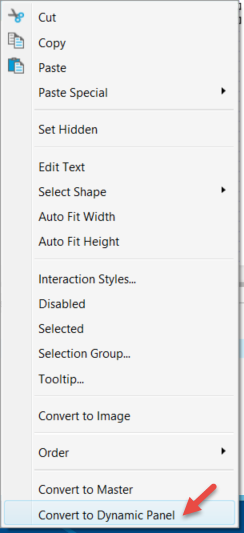
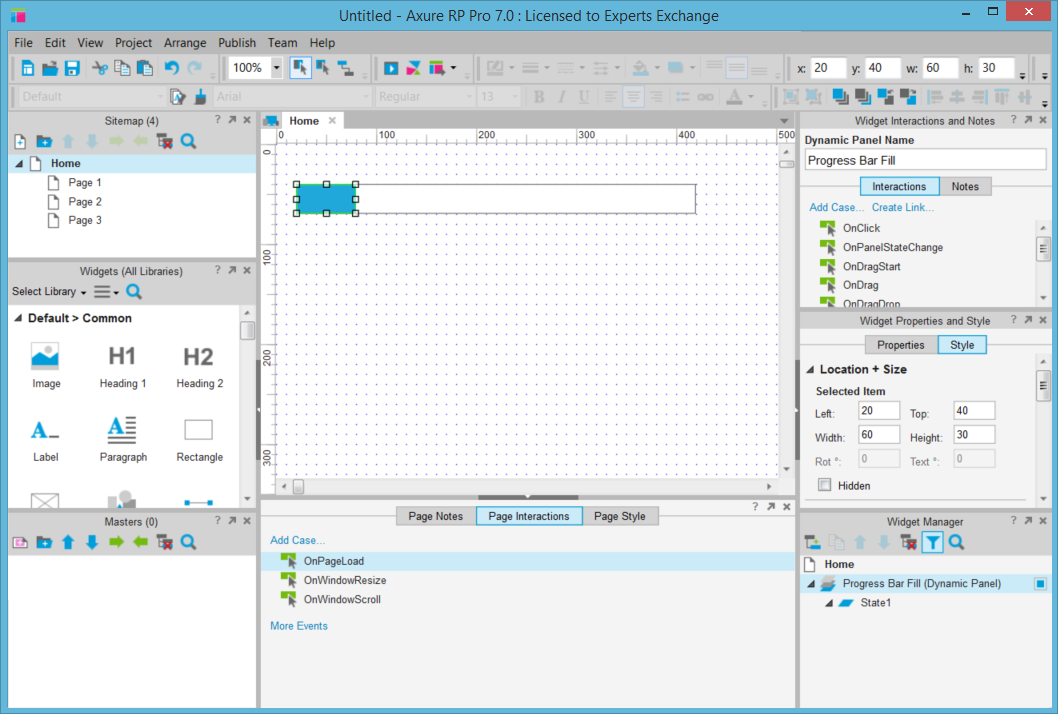
3.) Convert the filled-in rectangle to a Dynamic Panel. You can do this by right-clicking on it and choosing Convert to Dynamic Panel from the menu.
4.) Position the Dynamic Panel directly over top of the progress bar outline rectangle. To help make it clearer in the static wireframe that this is a progress meter, resize the Dynamic Panel to only partially fill the outline.
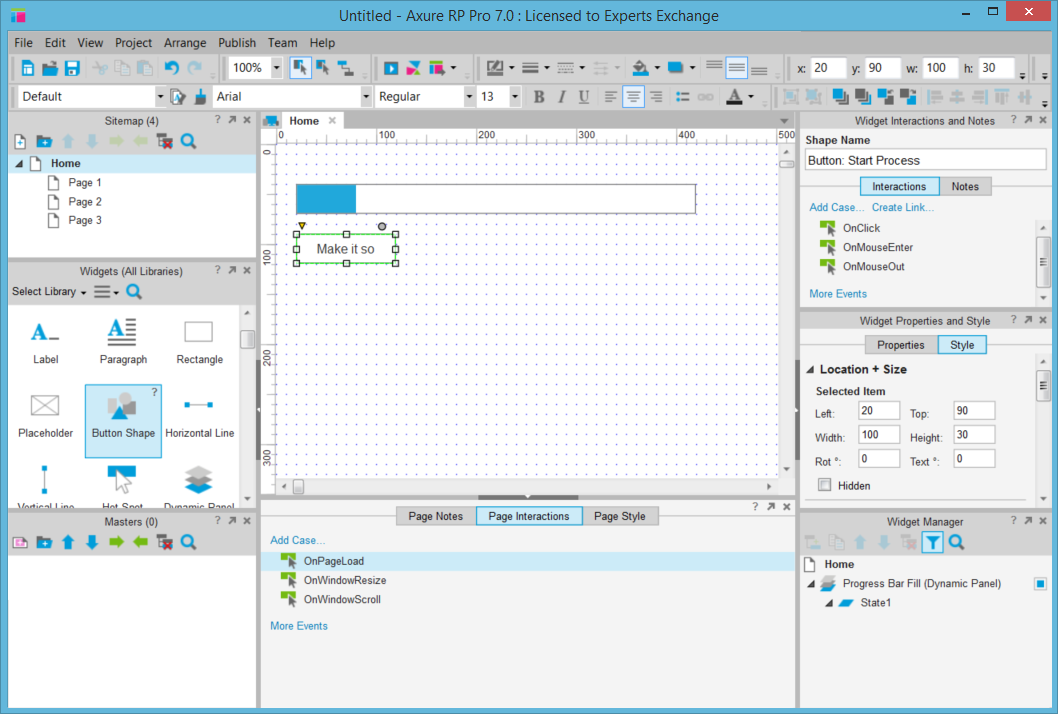
5.) Add a button to the page, which you'll use to trigger the animation of the progress bar filling up.
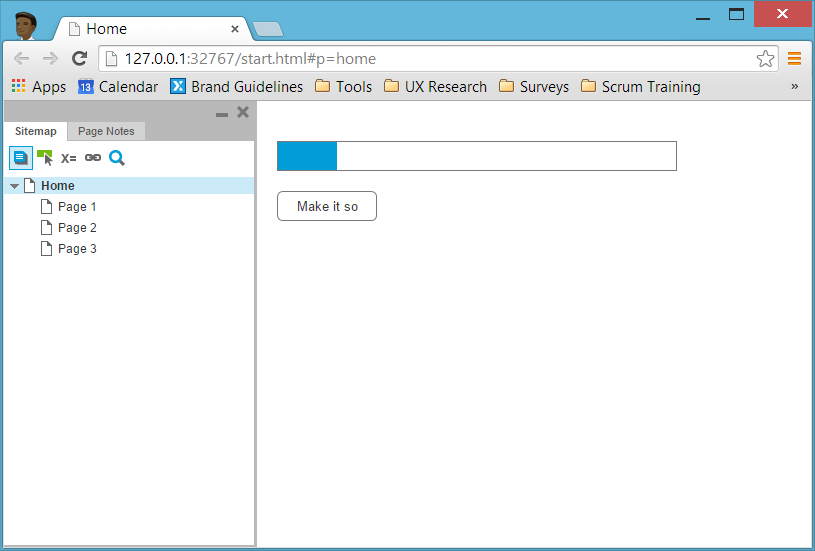
6.) Preview the prototype in your web browser by either going to the Publish menu and choosing Preview, or hitting the F5 key. The resulting prototype won't really do anything, but that's ok, we're just verifying that we've got the basic wireframe layout in place.
Part 2: Animating the Progress Meter
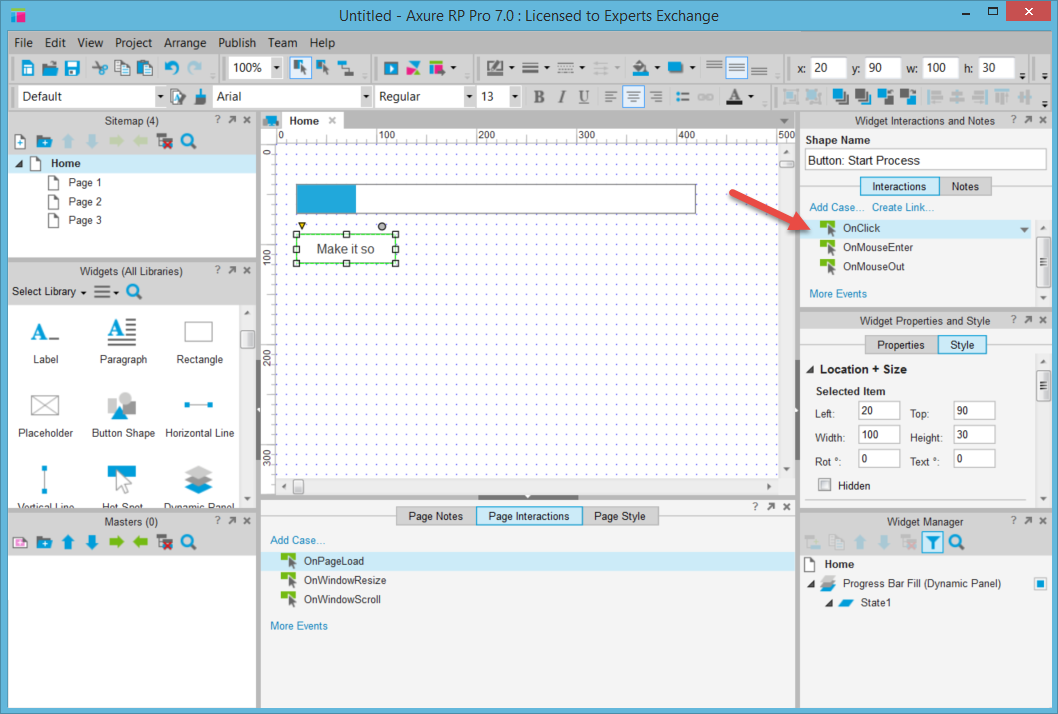
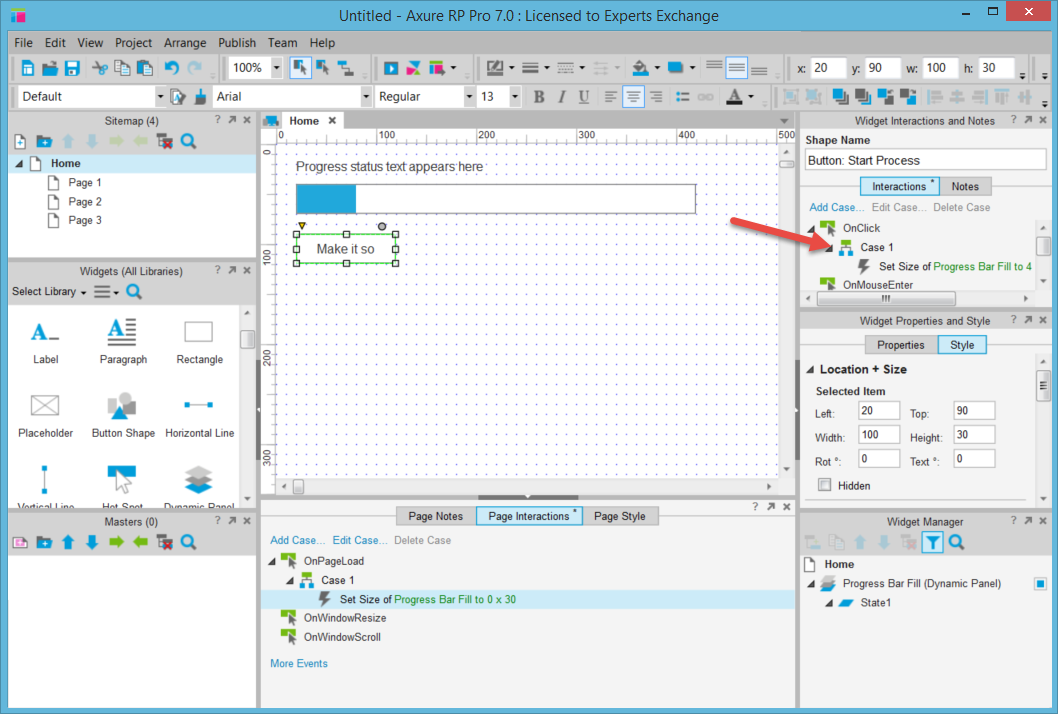
1.) Select the button you created at the end of Part 1. In the Widget Interactions and Notes pane, select the Interactions tab and then double-click the OnClick event.
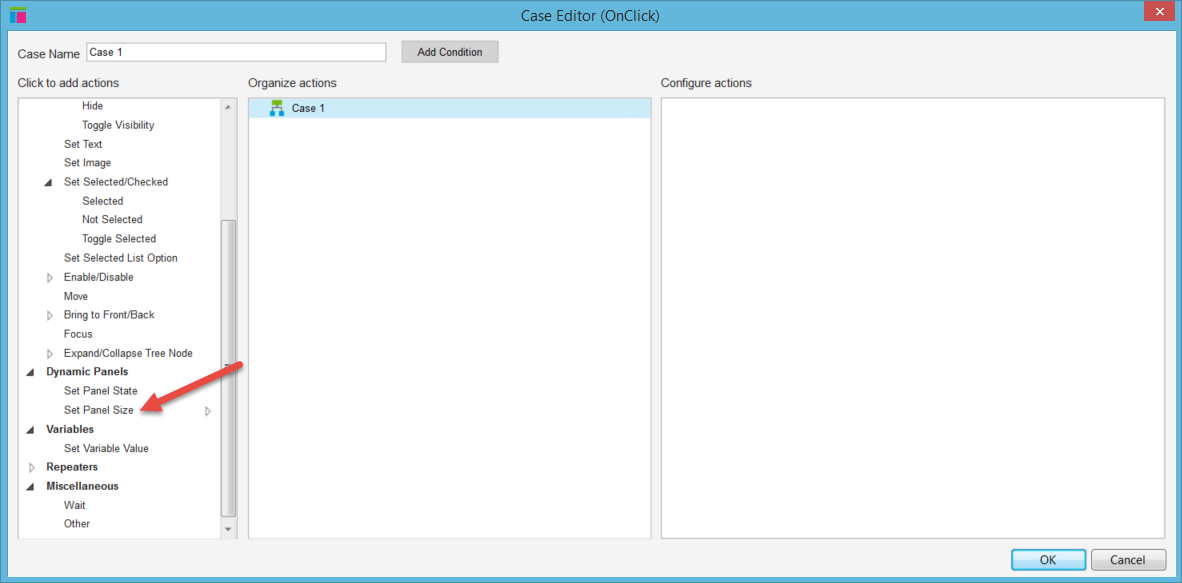
 2.) In the Add Actions list on the left, under the Dynamic Panels section, choose the Set Panel Size action.
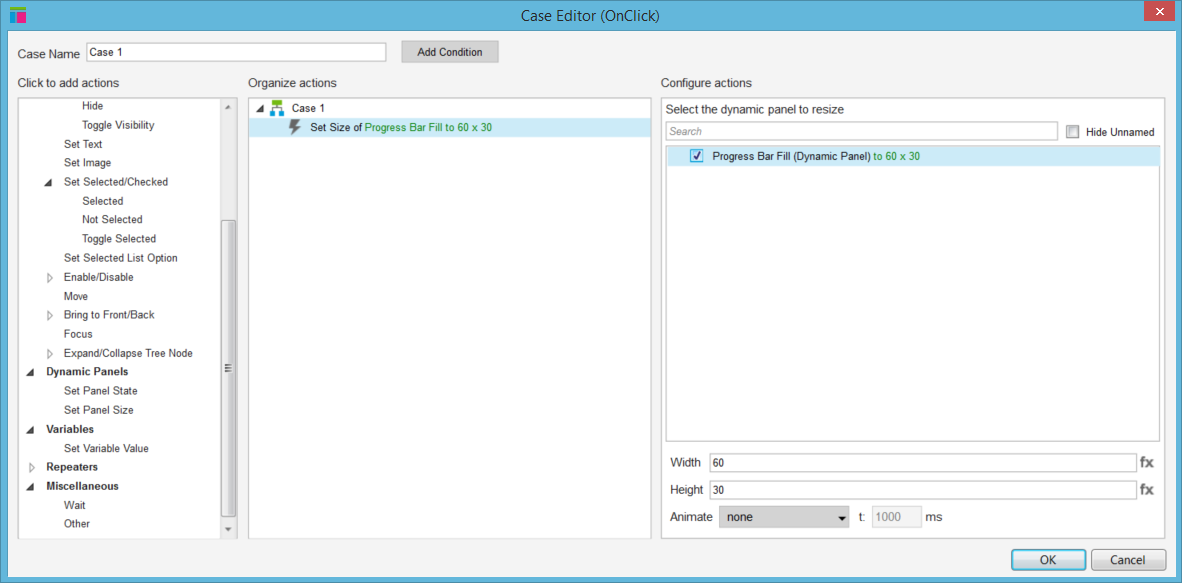
 3.) Now, in the Configure Actions section on the right, check the box for the Dynamic Panel you created to use as the Progress Meter Fill. (And as you can see in the screenshot below, I gave mine the convenient name of "Progress Bar Fill". If I had a lot of Dynamic Panels on the page, it'd be easier to pick this one out as a result.)
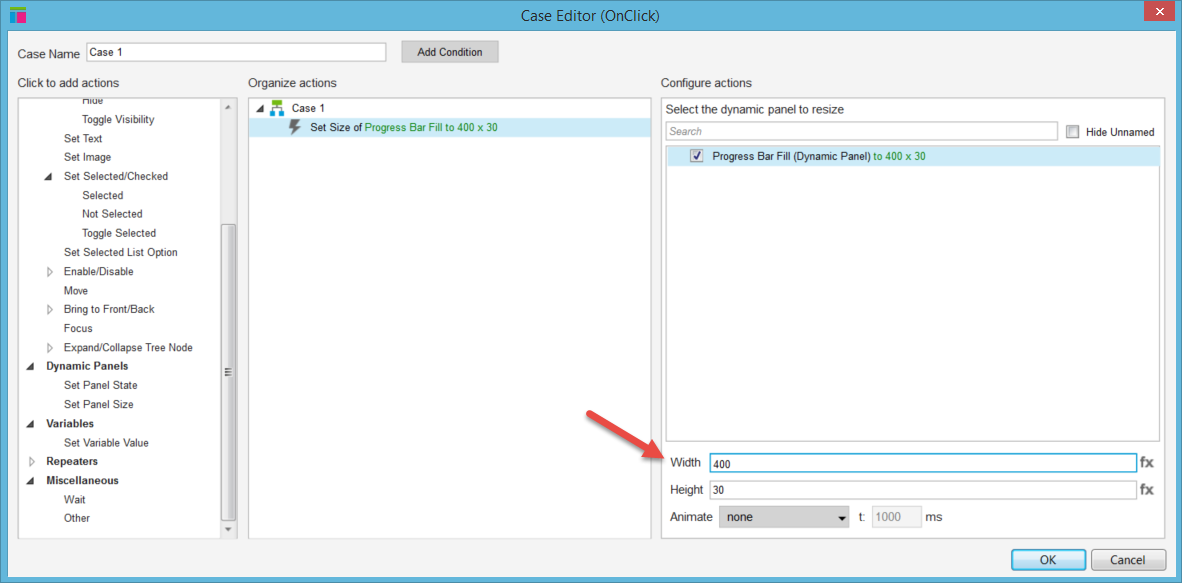
 4.) Set the Width value to the full width of the progress bar's outline. (Which you noted in Step 1 of Part 1, remember? Mine had been set to 400 pixels.)
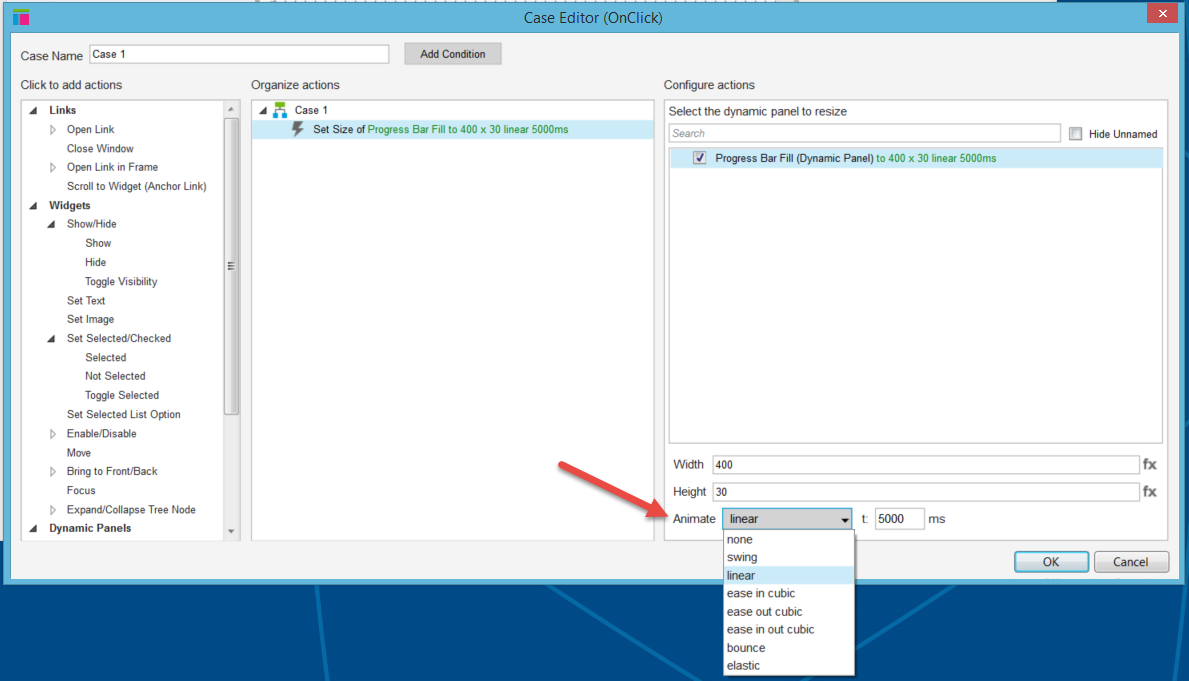
 5.) From the Animate dropdown, select Linear and give it a time value that you'd like to use. (I wanted mine to take 5 seconds, so I set the time to 5000ms.)
 6.) Hit the OK button to confirm the new action and close the window.
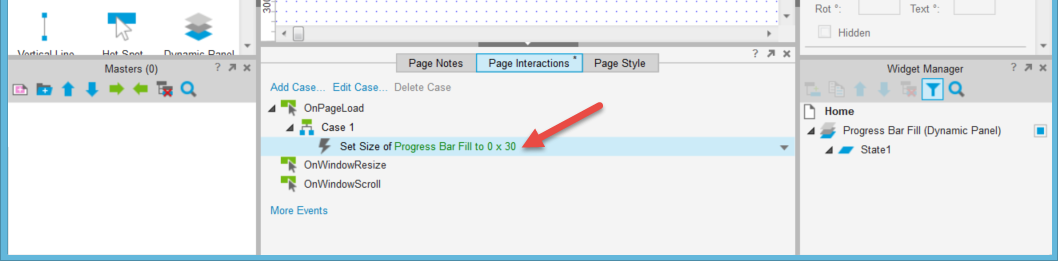
7.) Finally, we need to make sure that the progress meter starts off in the unfilled state, so in the Page Properties pane, go to the Page Interactions tab and double-click the OnPageLoad event. Follow the same steps as 3 & 4, but this time, set the Width value to 0 (and don't give it an Animation.)
 8.) Preview the prototype in your web browser. This time, the progress meter will start out unfilled. Upon clicking the button, the meter should now fill up, taking as long as you set in step 5.
Part 3: Adding Progress Text
As an added bonus, let's get even fancier and add in some progress status text that changes as the meter fills up.
1.) Add a Label widget above the progress meter. Let's edit its text to be "Progress status text appears here"
 2.) We're going to be editing what happens after clicking the button which starts the progress meter, so select it and double-click on Case 1 of the OnClick event.
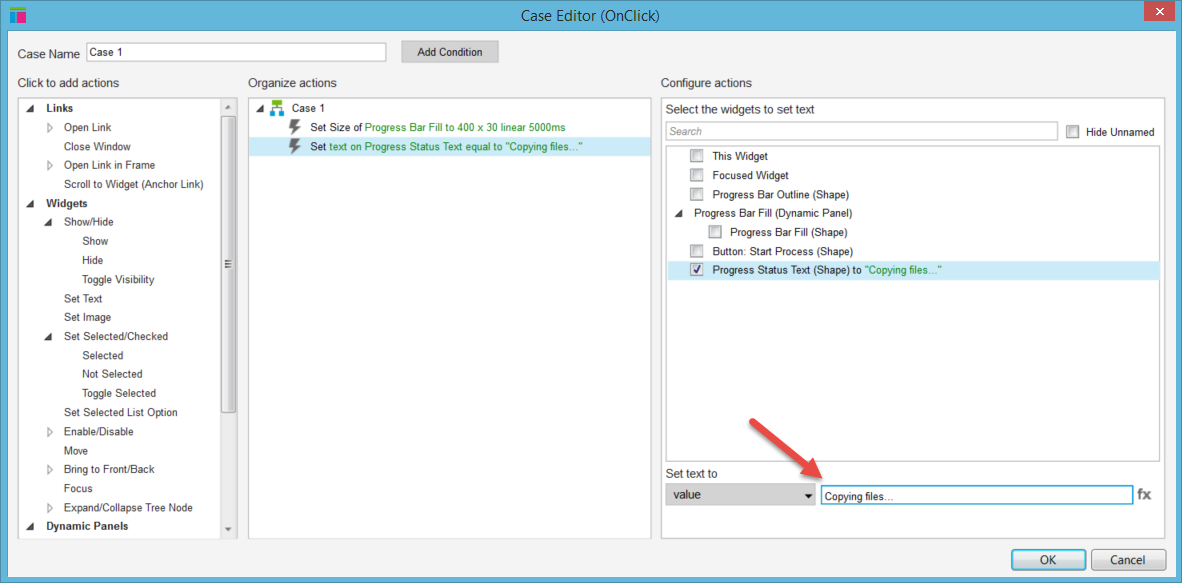
3.) We'll be making use of the Set Text action, so select it from within the Widgets section of the actions list.
 4.) In the Configure Actions section, select the Label widget that you created earlier. (And note that if you've been labeling everything per my earlier protip, it'll be easy to find this. Otherwise, your list of widgets on the page to choose from will be full of generic names. Good luck finding the right thing if you do that! ;-)
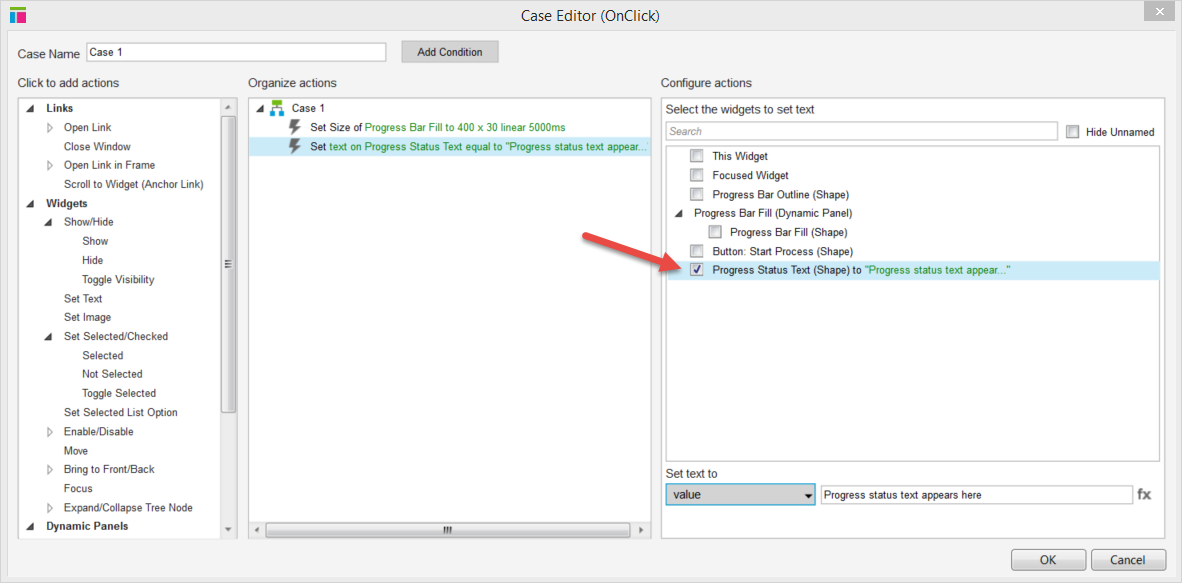
5.) Now let's edit the text that will appear for the label. Delete the existing "Progress status text appears here" and set it to something that makes sense as the first stage of the imaginary process that this progress meter exists for. I went with "Copying files..."
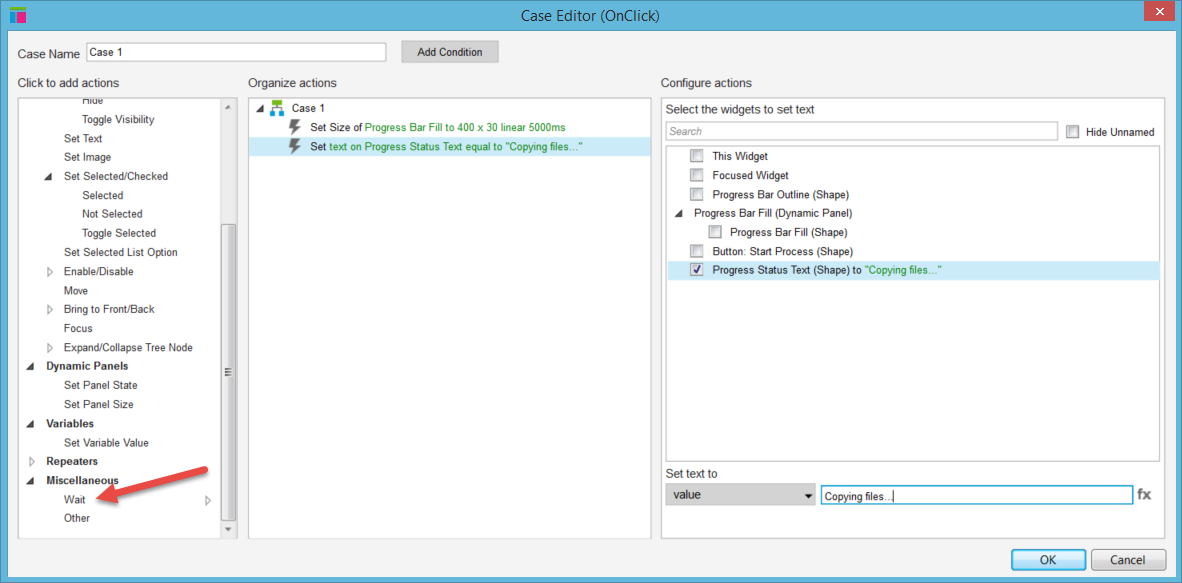
6.) Next, we're going to add in a delay so that the text will stay there for a moment before we put in another Set Text action to change it to the next bit of status text. For this, we'll add in a Wait action, which you'll find in the Miscellaneous section.
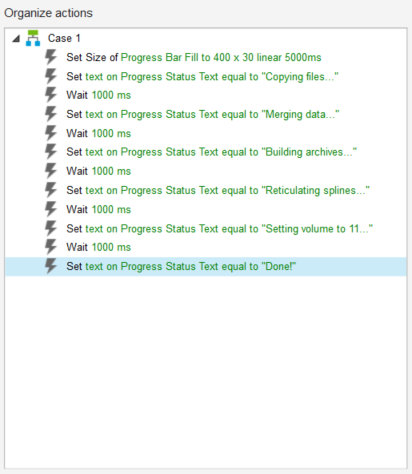
 7.) Add in another Set Text action to change the progress status text again. In fact, we'll do this a few more times, alternating with the wait action, until we've got a couple of different bits of text appearing for each step of the imaginary process. Since I had set my progress meter to take 5 seconds, I'm going to have 5 different bits of status text, with a 1 second delay between each one, and then a final "Done!" status. Here's my completed setup:
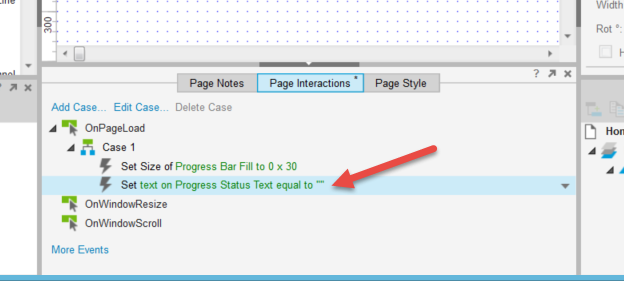
 8.) And finally, let's not have any progress status text until after the user clicks the button. To do this, in the OnPageLoad event, we'll do a Set Text action on the status text label to make it blank.
 9.) Preview the prototype in your browser, and now when you click the button, not only will the progress meter fill, but status text will appear above it and update to describe each step of our imaginary process.
 Congrats!
Next Steps
This progress bar is pretty basic, but you can leverage the fundamentals you've learned here to create more intricate prototypes. For example, you may want to have the text on the submit button change or get rid of the button entirely after the progress meter fills. You could also try only partially filling the meter to demonstrate a score within a particular range. Or show a user's current progress through a multi-step process, by having the progress bar increment after the user completes each step.In any case, I hope you've enjoyed this lesson and wish you the best in your prototyping endeavors!

Product Manager. Photographer. Runner. Gamer. Mostly human.
Have a question about something in this article? You can receive help directly from the article author. Sign up for a free trial to get started.
Comments (4)
Commented:
Author
Commented:I had actually planned to write that method in the tutorial, but fortunately I discovered the new feature in v7 and was able to simplify things tremendously.
Commented:
Author
Commented: