Automating the Creation of Visio Gantt Charts from Excel Data


Visio enthusiast, teacher, and MVP. Co-inventor of TaskMap: process mapping for the rest of us. Avid cyclist. Father of two daughters.
Published:
Browse All Articles > Automating the Creation of Visio Gantt Charts from Excel Data
A recent Visio zone question asked how to use the data in an Excel file to create a Visio Gantt chart -- and then to dynamically update the Gantt chart.
The good news is that the Viso Gantt Chart wizard can be automated. The bad news is that there doesn't appear to be a simple, direct way to accomplish the automatic updates.
However, the four steps described in this article will allow you to create an updated Gantt chart whenever you’d like and to do so with a single command!
Overview
The method I'm proposing in this article involves four steps that are summarized here and explained in more detail below:
In preparation for using the method described here, review this page in the Visio 2007 help text:
http://office.microsoft.com/en-us/visio/HP010303431033.aspx
Click either the + sign or the text "Command arguments for Gantt charts" to open a detailed description of the command line parameters for the Gantt Chart Wizard.
The remainder of this article provides detailed instructions for the steps above.
Step 1 -- Create a new Gantt chart document
With Visio running, use the appropriate selection from Visio’s File menu:
When the new Gantt Chart document opens, you will see the Gantt Chart Options dialog shown below.
![Gantt chart options dialog]()
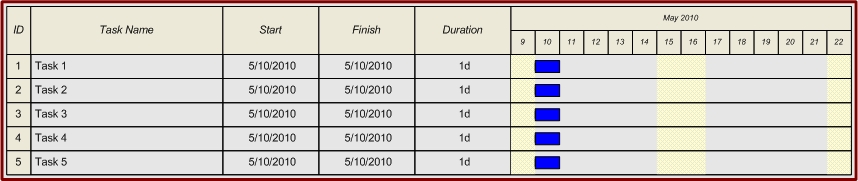
Click OK to accept the default parameters and create a Gantt Chart that looks like this:
![Generic Gantt chart]()
An Important Aside
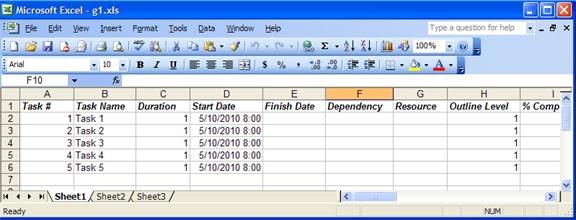
Before you can use the data in an Excel file to create a Gantt chart, you need to know the Excel file format required by the Gantt Chart wizard. Conveniently, the Gantt Chart Wizard has an export option so you can use it, along with the generic Gantt chart you created above, to generate an Excel file. You can then delete the data from the Excel file and replace it with your own.
To create an export file, select Gantt Chart>Export... from Visio’s main menu. After accepting the defaults in the export wizard and providing a file name for the Excel file, the resulting file will look something like this (there are many more columns to the right):
![Generic Excel file format]()
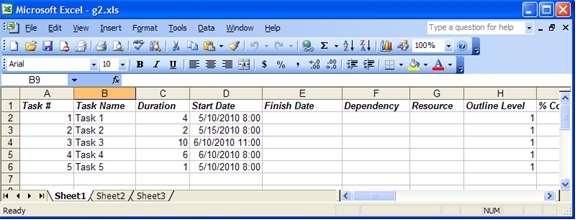
So that the Gantt chart we create in this article will be different than the generic example, I've changed a couple of dates and durations as shown below:
![Excel file format with modified data]()
Save and close the Excel file.
Step 2 -- Manually create a Gantt Chart from an Excel file
Select Gantt Chart>Import... from the Visio main menu. Step through the sequence of dialogs shown below.
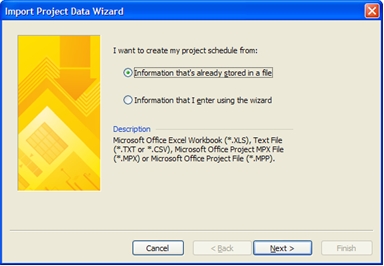
In the first dialog, click Next to use "Information that's already stored in a file".
![Import dialog 1]()
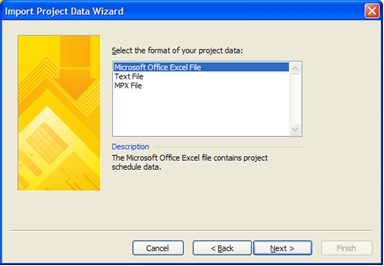
Choose Excel as the file type, then click Next.
![Import dialog 2]()
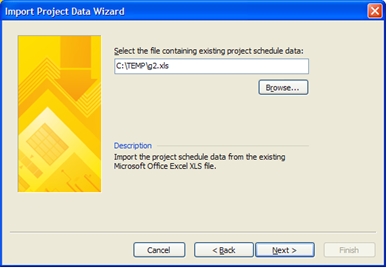
Locate your Excel file, then click Next.
![Import dialog 3]()
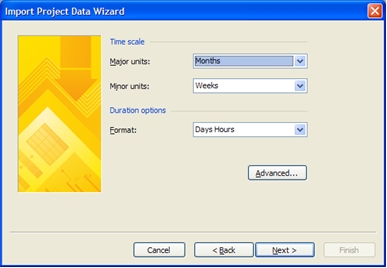
Accept the defaults or choose your own values, then click Next.
![Import dialog 4]()
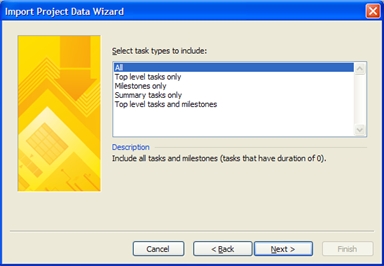
Unless you know you want to use a different value, accept the default value of "All" by clicking Next.
![Import dialog 5]()
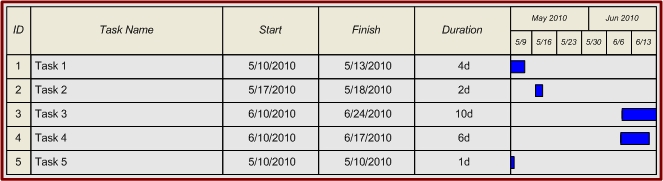
After you click Finish in the final dialog, the wizard will create a new page and insert a Gantt chart on it.
![Gantt chart created from Excel data]()
Step 3 -- Change the Excel data
Just to prove that the next step really produces an updated Gantt Chart, change some of the data in your Excel file, then save and close the file. (Note: the file must be closed for Visio to read it.)
Step 4 -- Run the Gantt Chart Wizard from the command line
The simplest option for running the Gantt Chart wizard programmatically is to run it from the command line using the first parameter described in the help text cited above. This parameter -- /USE-LAST-VALUES -- causes the wizard to reuse the most recent set of Gantt Chart Import Wizard settings, which is why I had you run the wizard once manually in step #2.
To run the wizard from the Windows command line, either 1) open the run dialog by pressing Windows key + R, or 2) open a Command Prompt window by selecting Start>All Programs>Accessories>Command Prompt .
Regardless of which method you use, type or paste the appropriate command based on your version of Visio (NOTE: quotation marks are required):
If you already have a Gantt chart document open, the wizard will add a new page and place your Gantt chart on it. If you don't have a Gantt chart document open, the wizard will open one and create your Gantt chart on page 1.
Repeat, As Desired
You now have everything you need to create an updated Gantt chart any time you’d like -- just repeat step 4.
By the way, in case you're wondering, Visio does remember the "last values" from the most recent import even if you stop Visio and start it again later.
Dynamic Updates
You’ve learned how to create a Gantt Chart from an Excel file using a single command, but this doesn’t solve the problem of creating dynamic updates. In order to have your update command run at a predefined time interval or based on some other occurrence, you will need to embed the command line from Step 4 in a program.
One option would be to write your own VBScript or other program to execute the command line. Another alternative would be to adapt the sample VBA program located in the above-referenced help text article. (If the sample program is hidden, click either the + sign or the text "Run the Import Project Data Wizard from a program using the Run method" at the bottom of the help text page.)
Summary
The steps described in this article allow you to create a Gantt Chart from Excel data any time you’d like. There is one risk, however, with using these instructions. If you or someone else imports data from a different file or changes any of the other import parameters, the next time you run the Gantt Chart wizard from the command line, you will get different results. "/USE-LAST-VALUES" means just what it says -- the wizard will use the values from the last time it was run.
If you want to ensure that your command line program always does exactly what you want, you'll need to utilize the detailed import wizard parameters described in the Visio help text article referenced above.
The good news is that the Viso Gantt Chart wizard can be automated. The bad news is that there doesn't appear to be a simple, direct way to accomplish the automatic updates.
However, the four steps described in this article will allow you to create an updated Gantt chart whenever you’d like and to do so with a single command!
Overview
The method I'm proposing in this article involves four steps that are summarized here and explained in more detail below:
Create a new Gantt chart document
Run the Gantt Chart Import Wizard manually to create a Gantt chart from your Excel data (this step is necessary to establish the import parameters that will be used in step 4)
Change the data in your Excel file
Recreate your Gantt chart by running the Gantt Chart Import Wizard with a single command
In preparation for using the method described here, review this page in the Visio 2007 help text:
http://office.microsoft.com/en-us/visio/HP010303431033.aspx
Click either the + sign or the text "Command arguments for Gantt charts" to open a detailed description of the command line parameters for the Gantt Chart Wizard.
The remainder of this article provides detailed instructions for the steps above.
Step 1 -- Create a new Gantt chart document
With Visio running, use the appropriate selection from Visio’s File menu:
Visio 2003: File>New>Project Schedule>Gantt Chart
Visio 2007: File>New>Schedule>Gantt Chart
Visio 2010: File>New>Schedule>Gantt Chart
When the new Gantt Chart document opens, you will see the Gantt Chart Options dialog shown below.
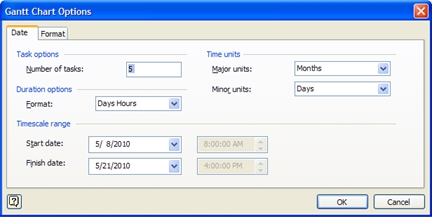
Click OK to accept the default parameters and create a Gantt Chart that looks like this:
An Important Aside
Before you can use the data in an Excel file to create a Gantt chart, you need to know the Excel file format required by the Gantt Chart wizard. Conveniently, the Gantt Chart Wizard has an export option so you can use it, along with the generic Gantt chart you created above, to generate an Excel file. You can then delete the data from the Excel file and replace it with your own.
To create an export file, select Gantt Chart>Export... from Visio’s main menu. After accepting the defaults in the export wizard and providing a file name for the Excel file, the resulting file will look something like this (there are many more columns to the right):
So that the Gantt chart we create in this article will be different than the generic example, I've changed a couple of dates and durations as shown below:
Save and close the Excel file.
Step 2 -- Manually create a Gantt Chart from an Excel file
Select Gantt Chart>Import... from the Visio main menu. Step through the sequence of dialogs shown below.
In the first dialog, click Next to use "Information that's already stored in a file".
Choose Excel as the file type, then click Next.
Locate your Excel file, then click Next.
Accept the defaults or choose your own values, then click Next.
Unless you know you want to use a different value, accept the default value of "All" by clicking Next.
After you click Finish in the final dialog, the wizard will create a new page and insert a Gantt chart on it.
Step 3 -- Change the Excel data
Just to prove that the next step really produces an updated Gantt Chart, change some of the data in your Excel file, then save and close the file. (Note: the file must be closed for Visio to read it.)
Step 4 -- Run the Gantt Chart Wizard from the command line
The simplest option for running the Gantt Chart wizard programmatically is to run it from the command line using the first parameter described in the help text cited above. This parameter -- /USE-LAST-VALUES -- causes the wizard to reuse the most recent set of Gantt Chart Import Wizard settings, which is why I had you run the wizard once manually in step #2.
To run the wizard from the Windows command line, either 1) open the run dialog by pressing Windows key + R, or 2) open a Command Prompt window by selecting Start>All Programs>Accessories>Comma
Regardless of which method you use, type or paste the appropriate command based on your version of Visio (NOTE: quotation marks are required):
Visio 2003: "C:\Program Files\Microsoft Office\Visio11\DLL\PROJIMPT.EXE" /USE-LAST-VALUES
Visio 2007: "C:\Program Files\Microsoft Office\Office12\PROJIMPT.EXE" /USE-LAST-VALUES
Visio 2010: "C:\Program Files\Microsoft Office\Office14\PROJIMPT.EXE" /USE-LAST-VALUES
If you already have a Gantt chart document open, the wizard will add a new page and place your Gantt chart on it. If you don't have a Gantt chart document open, the wizard will open one and create your Gantt chart on page 1.
Repeat, As Desired
You now have everything you need to create an updated Gantt chart any time you’d like -- just repeat step 4.
By the way, in case you're wondering, Visio does remember the "last values" from the most recent import even if you stop Visio and start it again later.
Dynamic Updates
You’ve learned how to create a Gantt Chart from an Excel file using a single command, but this doesn’t solve the problem of creating dynamic updates. In order to have your update command run at a predefined time interval or based on some other occurrence, you will need to embed the command line from Step 4 in a program.
One option would be to write your own VBScript or other program to execute the command line. Another alternative would be to adapt the sample VBA program located in the above-referenced help text article. (If the sample program is hidden, click either the + sign or the text "Run the Import Project Data Wizard from a program using the Run method" at the bottom of the help text page.)
Summary
The steps described in this article allow you to create a Gantt Chart from Excel data any time you’d like. There is one risk, however, with using these instructions. If you or someone else imports data from a different file or changes any of the other import parameters, the next time you run the Gantt Chart wizard from the command line, you will get different results. "/USE-LAST-VALUES" means just what it says -- the wizard will use the values from the last time it was run.
If you want to ensure that your command line program always does exactly what you want, you'll need to utilize the detailed import wizard parameters described in the Visio help text article referenced above.
Visio enthusiast, teacher, and MVP. Co-inventor of TaskMap: process mapping for the rest of us. Avid cyclist. Father of two daughters.
Have a question about something in this article? You can receive help directly from the article author. Sign up for a free trial to get started.
Comments (2)
Commented:
Commented: