Fredd
asked on
Access VBA chart - list of methods/functions
Anyone know where there is an exhaustive list of the chart methods available in VBA for Access 2010. All of the things like changing the axes, title, data series, ... Many things appear a bit different than the way it works in Excel (e.g., .rowsource = , etc).
any pointers to books or web sites with all of the chart functions - or for that matter all of the vba methods available would be great. The only thing I can find is examples of particular solutions.
Debugging someone's code which uses it seems every possible chart "." indicator
thanks in advance.
any pointers to books or web sites with all of the chart functions - or for that matter all of the vba methods available would be great. The only thing I can find is examples of particular solutions.
Debugging someone's code which uses it seems every possible chart "." indicator
thanks in advance.
PatHartman
I have never seen a list like this. Also keep in mind that the chart object is no longer part of Access as of A2013. You might be better off spending your time trying to automate Excel to create a chart in an OLE window.
Methods, Properties, and Events all belong to "Objects", ...so do you need an exhaustive list of all Objects Properties Methods and Events?
I create complex charts all the time, ...I rarely need to use automation.
Many developers reach for an automation (code) solution because MS Access never made creating charts as straightforward as it is in Excel.
:-(
Many charting feature are quite easy to do if you now the basics of Chart manipulation.
(simply going into design view of the chart and making changes)
So perhaps if you just stated what your goal is with the chart, we could assist.
Or you could post a simple database with sample data and showed us a clear graphical representation of the chart you are after...
JeffCoachman
Many things appear a bit different than the way it works in Excel (e.g., .rowsource = , etc).
Almost everything is different because the Chart object comes from MSGraph and not Excel
There are commonalities, to be sure, but a lot of differences.
4000 data points and no more is one big one
And no, other than The ObjectBrowser, Intellisense and Google, I haven't come across anything good.
@PatHartman is not correct about the removal of Charts from A2013.
Pivot Tables and Pivot Charts were yanked, but not charts themselves.
And unlike @JeffCoachman, I haven't found the chart or chart wizard to be my friend. But once you get the object on the form/report tearing out the cruft by starting with a sane recordsource in VBA does wonders.
What stuff are you trying to make sense of?
Nice to know my charts will still work if we ever move to A2013. Or maybe, if we wait just a little longer, we will skip A2013 all together and to with A2016
ASKER
Thanks @Nick67 - I'm trying to make sense of an elaborate subroutine which creates charts - using chart objects and things like
dim ochart as object
ochart.rowsource = "Words; std1; std2; std3;Poor;1.0; 2.0. 1.4; Medium; 2.;3.;4;"
with ochart
with .seriescollection("Name here")
.charttype = xllinemarkers ' for example, where do I learn about other values for .charttype?
. markerstyle = xlDiamond ' what are the others?
end with
end with
most places I see .seriescollection uses a number (e.g., .seriescollection(1) )
I cannot post actual code or the database for legal reasons.
I'm running in Access 2013 and the chart thing works just fine.
I need a dictionary or some way to know what the possible values are - I'm coming up empty with what can come after the chart object type - must be somewhere I would think. Books do not cover charting in Access it seems.
I'm working with something with thousands of lines of code (between querying the data, running the UI, and then doing the charting )just in the charting section of the application and don't want to even think about re-writing it all in excel or anything else. I'm getting error traps on some of his values - which appear correct to me as it works in other code elsewhere in the application.
I guess I can turn on record macro over in excel, do a chart, and then see what the vba is spits out is.
I think he did that in some cases it appears.
However he doesn't have a lot of extra code that the record macro generates.
thanks for any assistance.
<darkly>
Considering that the biggest buzz that MS has about Access is that you should be using it to replace the now-deprecated InfoPath, all you may have to look forward to is further deprecations and SharePoint cruft.
Considering that the biggest buzz that MS has about Access is that you should be using it to replace the now-deprecated InfoPath, all you may have to look forward to is further deprecations and SharePoint cruft.
dim ochart as object
So, someone has done you the favour of late-binding the whole mess.
Which is nice in terms of code portability and very, very bad in terms of intellisense and the object browser.
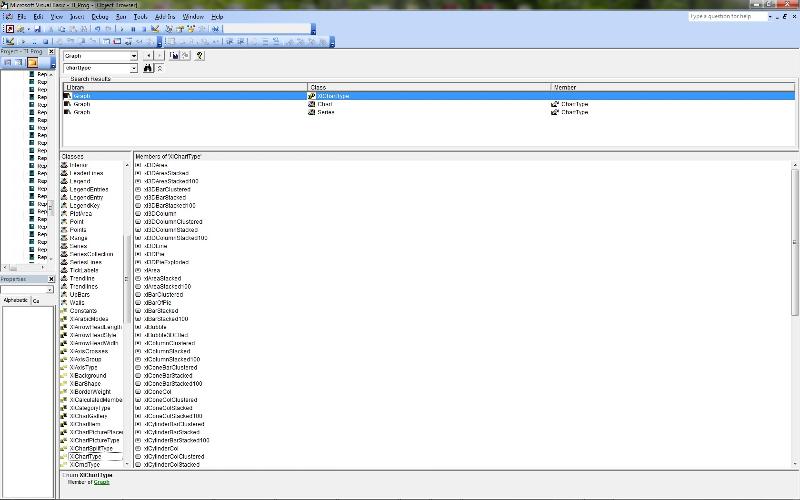
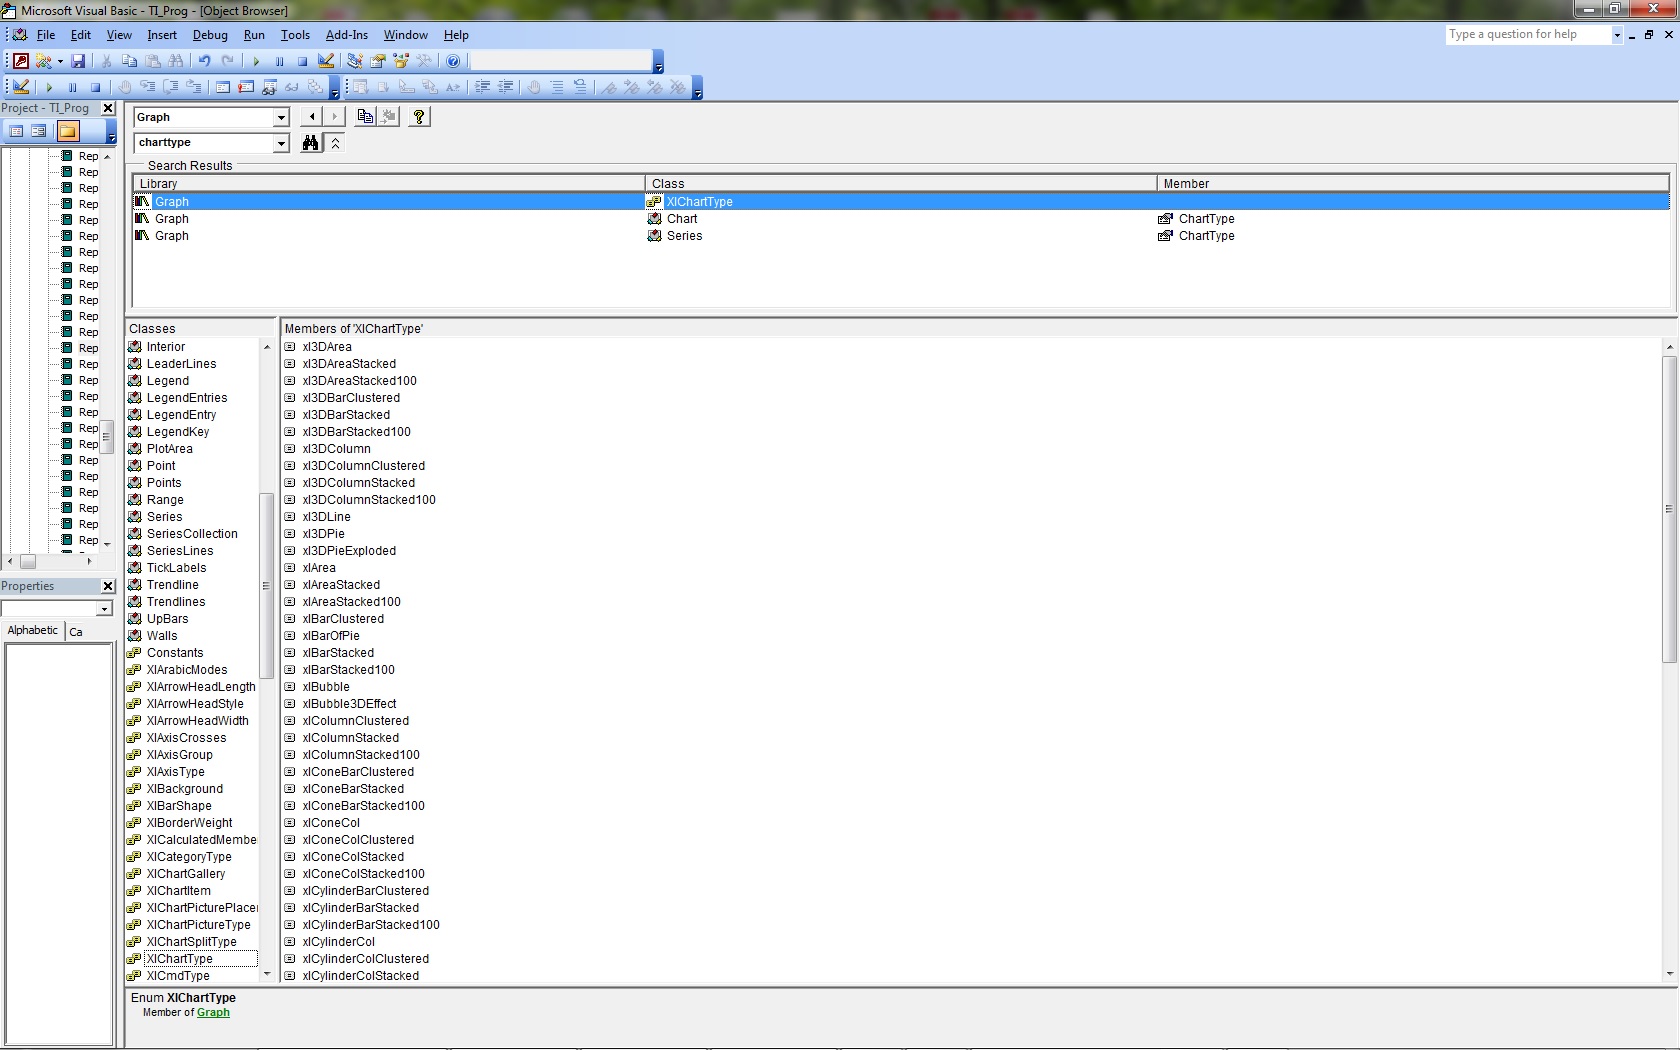
You'll at least temporarily want a reference to Microsoft Graph xx.0 object library.
You can then use the object browser and intellisense
Open the object browser.
Select Graph as the Library.
Have a look-see.
' for example, where do I learn about other values for .charttype?
So, someone has done you the favour of late-binding the whole mess.
Which is nice in terms of code portability and very, very bad in terms of intellisense and the object browser.
You'll at least temporarily want a reference to Microsoft Graph xx.0 object library.
You can then use the object browser and intellisense
Open the object browser.
Select Graph as the Library.
Have a look-see.
' for example, where do I learn about other values for .charttype?
ASKER
Very helpful - I also have the word and excel object libraries for this application.
The version of this which runs other charts properly but not this particular chart has
.rowsource = "Words; std1; std2; Poor; 1.0; 2.0 ; Good ; 3.0, 4.0; "
and then
.seriescollection("Poor") which I gather is pointing to the values 1.0 and 2.0 in this example.
But everywhere I look has .seriecollection(index number here).
There is a version of this working doing other certain charts using this technique. but it's not working (I'm getting runtime errors setting .seriescollection property on the target application section.
Unsure if I'm being clear, I might just re-write the whole section but it's hundreds of lines in this one section to set up the chart not to mention the SQL stuff.
thanks again
Object browser was very helpful -
ASKER CERTIFIED SOLUTION
membership
This solution is only available to members.
To access this solution, you must be a member of Experts Exchange.
The version of this which runs other charts properly but not this particular chart has
.rowsource = "Words; std1; std2; Poor; 1.0; 2.0 ; Good ; 3.0, 4.0; "
and then
.seriescollection("Poor") which I gather is pointing to the values 1.0 and 2.0 in this example.
That's a highly odd RowSource! Unless it is getting whacked and replaced by something else later.
Generally, you have a "Select SomeXAxisValue, SomeYAxisValue from someplace"
.seriescollection(0) is the first field
.seriescollection(1) is the next field and so on...
ASKER
Exactly what I see in other examples - but he has this crazy format in several places which are working so I don't want to disturb them - with 37K lines of code, a lot goes on in this application which is a black box to me.
It works (mostly) except for a few charts here with this weird construct.
anyway - thanks for the help.
It works (mostly) except for a few charts here with this weird construct.
anyway - thanks for the help.
I would still like to see the raw data and the desired graph...
Again, Just to see if the output can be recreated by just manipulating the chart object.
Again, Just to see if the output can be recreated by just manipulating the chart object.
ASKER
@Jeffrey - I can't display the raw data in any form. I got the information I needed from Nick - thanks