

Browse All Articles > PowerPivot Inside Out (Part 1/3)
The following article is kind of a baseline knowledge one should possess before attempting the creation of their first PowerPivot workbook in Excel. I have always believed that understanding is key so this article is written to deepen your understanding of how the PowerPivot Add-Inn for Excel works and what’s actually happening under the hood. In the process of reading this article you will also be given many reasons for using PowerPivot in Excel. Although I borrowed the title from Microsoft books, this will be just as Informative but much shorter :).
Just as an extra point I would like to point out that Power Pivot V1, V2 and Power Pivot for Excel 2013 are not interchangeable. If you have Power Pivot data in Excel 2013 you cannot open that data in Excel 2010. In the opposite case, it does offer to upgrade your data from 2010 to 2013 however. But once you’ve done so, you cannot open it in 2010!
![Table]()
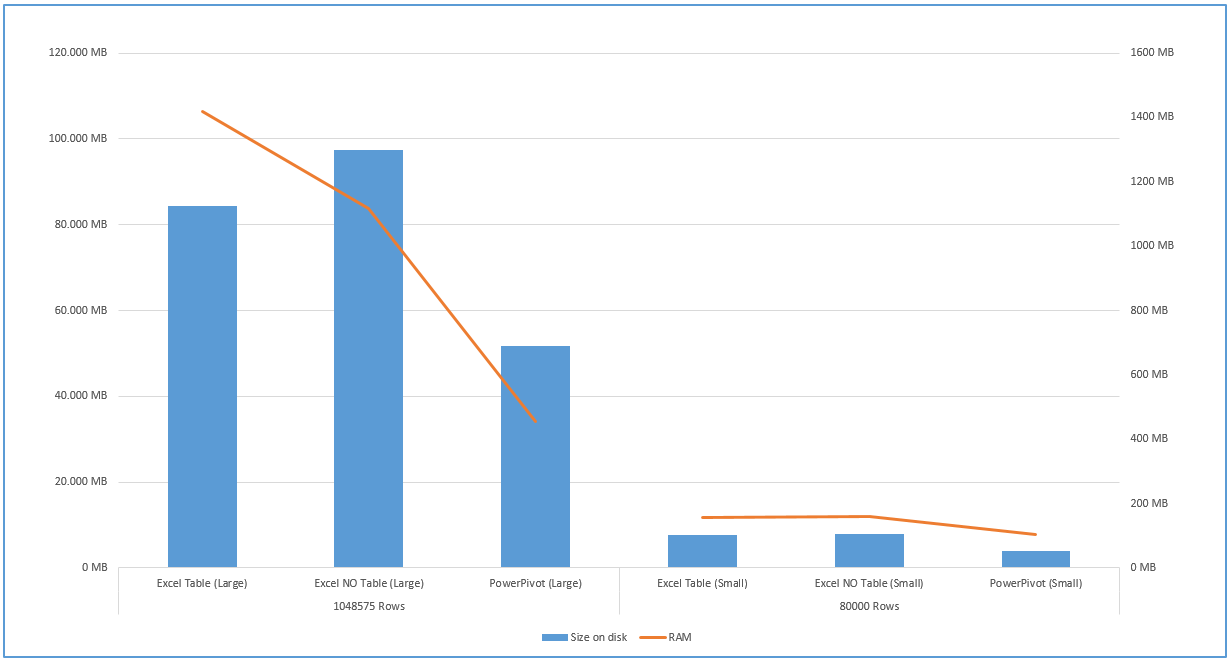
![Graph]() But leaving this comparison aside for a moment, let us explain how we can save space with the import of data into PowerPivot. The thing to understand is that when you import a table from any source into PowerPivot, it’s not the number of rows that should concern you, it’s the number of columns. The reason why this is so is the way that PowerPivot indexing works. Now if you have a column called Company in a table that has hundreds of millions of rows but there are only thousand unique companies, than this column requires almost no space on disk and RAM. But if you have a field with many unique values (like ID) than that will take up a lot of resources. You can see the difference in below, but let us just conclude by saying this:
But leaving this comparison aside for a moment, let us explain how we can save space with the import of data into PowerPivot. The thing to understand is that when you import a table from any source into PowerPivot, it’s not the number of rows that should concern you, it’s the number of columns. The reason why this is so is the way that PowerPivot indexing works. Now if you have a column called Company in a table that has hundreds of millions of rows but there are only thousand unique companies, than this column requires almost no space on disk and RAM. But if you have a field with many unique values (like ID) than that will take up a lot of resources. You can see the difference in below, but let us just conclude by saying this:
![.data file]() In the xl folder you will find a folder called model. Now in that folder you can find a file that has a .data extension. This is actually an offline OLAP cube that allows you to work with your data even if you cannot connect to a data source (being SQL server, Access file or an Excel file).
In the xl folder you will find a folder called model. Now in that folder you can find a file that has a .data extension. This is actually an offline OLAP cube that allows you to work with your data even if you cannot connect to a data source (being SQL server, Access file or an Excel file).
But when you open an Excel file that has PowerPivot data, first it will load as if no PowerPivot id present. The Pivot tables will be present and visible, but no Data Model will be loaded. That is until you either refresh a Pivot Table, change a filter or slicer value in a Pivot Table or open a PowerPivot window. Now that’s when you can see the RAM consumption go up, but there is a way that you can even see the memory consumption for each individual column or field.
Here is how. You go to C:\Users\[USER NAME]\AppData\Local\Temp. In the Temp folder you will find at least one folder called VertiPaq_* where a star represents the following 20 symbols. VertiPaq has changed is identity as xVelocity or officially as “xVelocity in-memory analytics engine (VertiPaq)” with SQL Server 2012. But essentially the size of this VetiPaq folder (you can guess the right one by the creation date) is very close to the RAM consumption of that Data Model. But it gets even better.
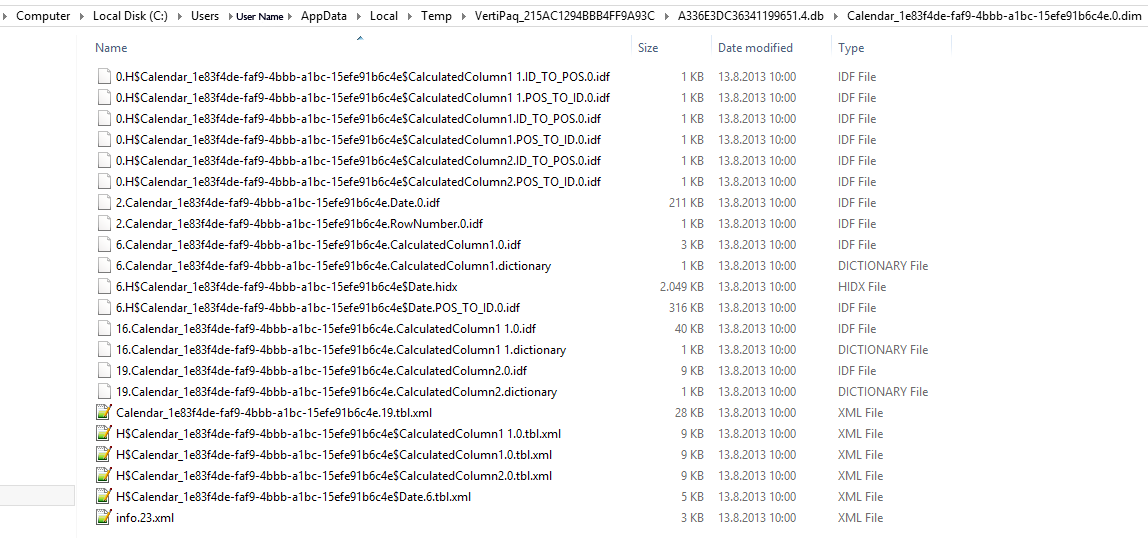
Inside the VertiPaq folder there is a folder with a .db at the end of its name. In this folder you will find folders representing the tables in your data model. Luckily here you can see the name of the table at the beginning of the folder name. And in this folder you have individual files representing the size of each column.
![VertiPaq]() And it’s clear to see that most space and RAM consuming column is Date, which is to be expected as it has most unique values.
And it’s clear to see that most space and RAM consuming column is Date, which is to be expected as it has most unique values.
For the cherry on the cake, you can resolve many problems in PowerPivot by deleting the VertiPaq folders (when the file is not running of course).
So this brings us to the end of part one, where we learned a lot of basic facts about Power Pivot. You can find Part two here. For a better understanding of PowerPivot vs. Pivot Table, you can read the following post: Power Pivot vs. Pivot Table.
1. First thing’s first. What is PowerPivot?
It’s an Add-In for Excel 2010 and 2013, and it brings SQL Server Analysis Services (SSAS) to Excel, but in a way that is new to Excel users as it is for T-SQL Professionals. The revolution does not stop there. It must also be said that it stores data far more efficiently than Excel does. More about that below. Comparing the amount of data that can be stored in PowerPivot vs. the amount in Excel goes something like 999.999.999 vs. 1.048.576. That’s not even the limit, it’s just the most I’ve seen… But rather than portraying this as a choice of one or the other, the fact is one cannot exist without the other. If you want to do amazing things in Excel, sooner or later you will have to use PowerPivot. So to answer the initial question, Power Pivot is an Add-Inn for Excel, which allows you to store large amounts of data in a compact form as a metadata of an Excel file and then analyze that data with Pivot Tables, Power View sheets or PowerMap projects.Just as an extra point I would like to point out that Power Pivot V1, V2 and Power Pivot for Excel 2013 are not interchangeable. If you have Power Pivot data in Excel 2013 you cannot open that data in Excel 2010. In the opposite case, it does offer to upgrade your data from 2010 to 2013 however. But once you’ve done so, you cannot open it in 2010!
2. What are the space and RAM requirements
Here is a basic comparison of a file size when data is in an Excel sheet, (just for fun I added a difference between formatting your data as a Table rather than just leaving it as a List) or in a Power Pivot metadata of an Excel file. As an added value, there is a significant difference in the consumption of RAM as can be seen in the table and chart.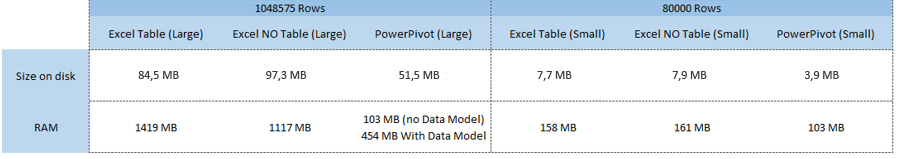
 But leaving this comparison aside for a moment, let us explain how we can save space with the import of data into PowerPivot. The thing to understand is that when you import a table from any source into PowerPivot, it’s not the number of rows that should concern you, it’s the number of columns. The reason why this is so is the way that PowerPivot indexing works. Now if you have a column called Company in a table that has hundreds of millions of rows but there are only thousand unique companies, than this column requires almost no space on disk and RAM. But if you have a field with many unique values (like ID) than that will take up a lot of resources. You can see the difference in below, but let us just conclude by saying this:
You can gain most (performance vise) at importing data, by only importing those columns(!) that you really need for your data model and analysis.
3. So where and how is the data stored?
As you know all Office files from 2007 on are basically a zip folder. So if you take your Excel file called test.xlsx and rename it to test.zip, you can browse through that file.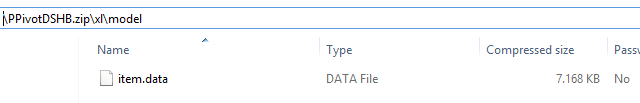 In the xl folder you will find a folder called model. Now in that folder you can find a file that has a .data extension. This is actually an offline OLAP cube that allows you to work with your data even if you cannot connect to a data source (being SQL server, Access file or an Excel file).
But when you open an Excel file that has PowerPivot data, first it will load as if no PowerPivot id present. The Pivot tables will be present and visible, but no Data Model will be loaded. That is until you either refresh a Pivot Table, change a filter or slicer value in a Pivot Table or open a PowerPivot window. Now that’s when you can see the RAM consumption go up, but there is a way that you can even see the memory consumption for each individual column or field.
Here is how. You go to C:\Users\[USER NAME]\AppData\Local\Temp. In the Temp folder you will find at least one folder called VertiPaq_* where a star represents the following 20 symbols. VertiPaq has changed is identity as xVelocity or officially as “xVelocity in-memory analytics engine (VertiPaq)” with SQL Server 2012. But essentially the size of this VetiPaq folder (you can guess the right one by the creation date) is very close to the RAM consumption of that Data Model. But it gets even better.
Inside the VertiPaq folder there is a folder with a .db at the end of its name. In this folder you will find folders representing the tables in your data model. Luckily here you can see the name of the table at the beginning of the folder name. And in this folder you have individual files representing the size of each column.
 And it’s clear to see that most space and RAM consuming column is Date, which is to be expected as it has most unique values.
For the cherry on the cake, you can resolve many problems in PowerPivot by deleting the VertiPaq folders (when the file is not running of course).
So this brings us to the end of part one, where we learned a lot of basic facts about Power Pivot. You can find Part two here. For a better understanding of PowerPivot vs. Pivot Table, you can read the following post: Power Pivot vs. Pivot Table.
Have a question about something in this article? You can receive help directly from the article author. Sign up for a free trial to get started.
Comments (0)