

Browse All Articles > Median, Mode, Skewness, and Kurtosis in MS Access
by Patrick G. Matthews
Like other database applications, Access provides support for computing basic descriptive statistics for a data set, offering such aggregate functions as Count, Sum, Min, Max, standard deviation and variance (StDev, StDevP, Var, and VarP), and average (Avg). In addition to these typical aggregate functions, Access also offers the so-called "domain aggregate" counterparts for each of the aggregates already mentioned.
That said, there are other useful descriptive statistics for data sets that Access does not support via native functions. This article will describe how to compute four additional descriptive statistics in Microsoft Access:
In the next four sections below, this article will describe how to compute the median, mode, skewness, and kurtosis statistics in Access, using examples that I replicate in the attached sample files.
In the Source Code section of this article, I include the VBA source code for four user defined "domain aggregate" functions: DMedian, DMode, DSkewness, and DKurtosis.
This article's Sample Files section includes two sample files, demonstrating the techniques described here with a set of sample data.
In the next to last section, I describe how to implement these new functions in your Microsoft Access projects.
Finally, this article is intended to show you how to compute the median, mode, skewness, and kurtosis statistics using Access, and is not meant as a primer in the statistical constructs or methods themselves. For readers interested in learning more about the statistics themselves, and how they fit into statistical methods such as hypothesis testing, please see the Further Reading section.
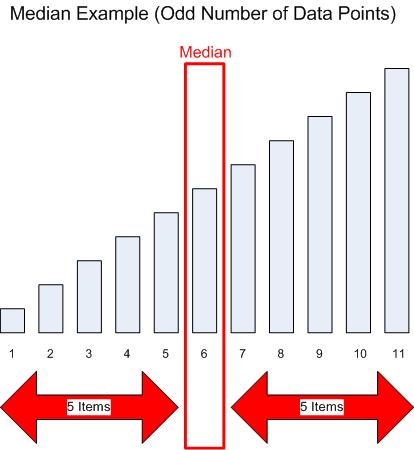
The median is a measure of central tendency that returns the "middle" value in an ordered set of data.
If there is an odd number of elements in the data set, then the median is that value for which the number of items preceding that value is equal to the number of items following that value:
![Median (Odd Data Points)]()
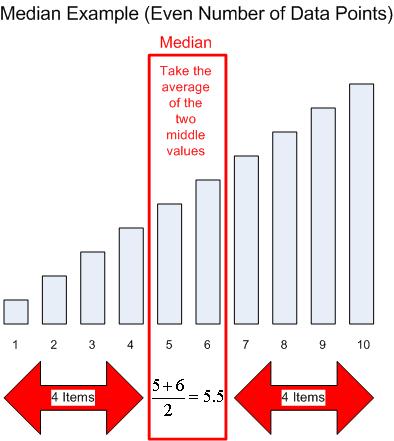
If there is an even number of elements, then the median is the simple average of the two middle elements:
![Median (Even Data Points)]()
In symmetrical distributions, the mean and the median are typically close in value. However, in skewed distributions, or in samples with extreme outliers, the difference between the mean and the median can be significant.
Access does not provide a native function for determining the median, and writing a SQL query to return the median is a difficult proposition:
Given these limitations, it is simply not feasible to rely on a pure SQL approach to calculate a median, and a VBA approach is preferred. For this purpose, I created the DMedian user defined function. It behaves similarly to Access's native domain aggregates, and takes the following arguments:
For the Column and Tbl arguments, I strongly recommended that you place the column/table/query names in square brackets. This is mandatory if your database object names violate the usual naming rules, such as by including spaces, punctuation, keywords, etc.
The Source Code section to this article contains the VBA source code for the DMedian function, and the sample database provided in the Sample Files section illustrates four use cases for DMedian on a set of sample data.
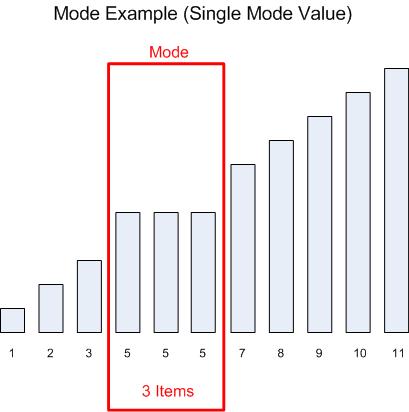
The mode is a measure of central tendency that returns the value(s) in the data set that appear most frequently. For example, in the data set below, the mode is 5:
![Mode (Single)]()
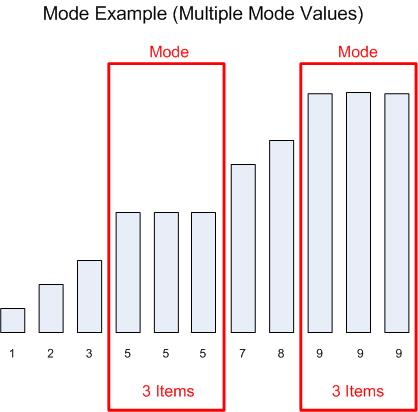
In case more than one value is tied for the greatest frequency, the mode is considered the set of all such values. For example, in this data set, the mode equals 5 and 9:
![Mode (Multi)]()
Unlike the median, you can use regular SQL quite readily to calculate the mode, by using sub-queries. However, in cases where there is more than one value in the mode, a pure SQL-based approach will output each modal value on its own row. If instead you prefer to have all of the modal values in a single column on a single row, you must use VBA to create a user defined function. You may also find DMode more convenient to use, rather than working out the subquery logic, although the pure SQL approach will execute more quickly.
I created the DMode user defined function fot this purpose. It behaves similarly to Access's native domain aggregates, and takes the following arguments:
For the Column and Tbl arguments, I strongly recommended that you place the column/table/query names in square brackets. This is mandatory if your database object names violate the usual naming rules, such as by including spaces, punctuation, keywords, etc.
The Source Code section to this article contains the VBA source code for the DMode function, and the sample database provided in the Sample Files section illustrates four use cases each for calculating modes using SQL and using DMedian.
The first four use cases illustrate a pure SQL approach to calculating the modes:
The next four use cases all demonstrate use of the DMode function to simplify the SQL statements:
Skewness and kurtosis describe the shape of your data set's distribution. Skewness indicates how symmetrical the data set is, while kurtosis indicates how heavy your data set is about its mean compared to its tails. Perfectly symmetrical data sets will have a skewness of zero, and a normally distributed data set will have a kurtosis of approximately three.
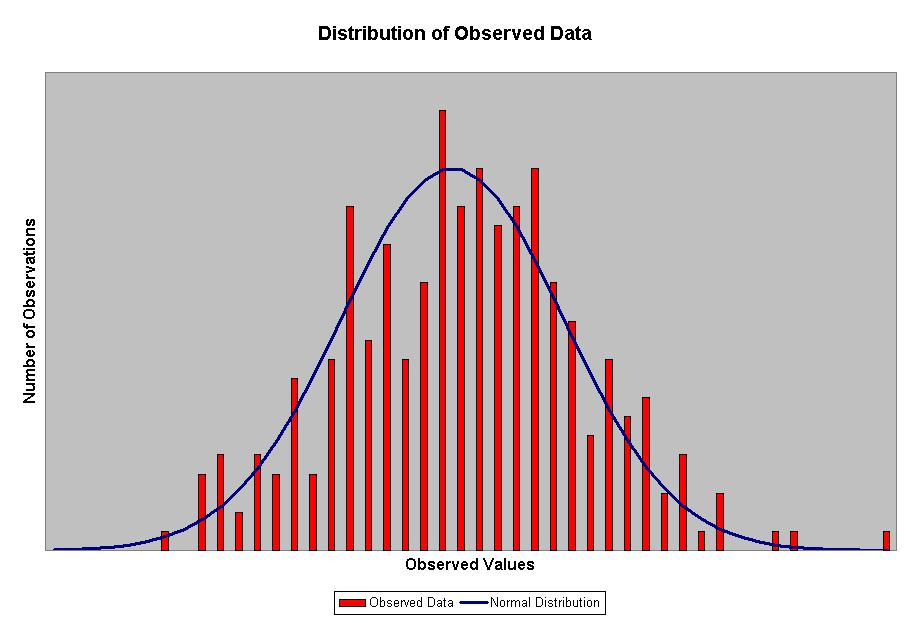
For example, this histogram (with an overlay of what a perfect normal distribution would have been) represents the total sample set available in the Access database included with this article:
![Sample distribution]()
As we can see, the sample set is reasonably symmetrical, and the overall distribution appears to be close to a normal distribution, and thus we would expect to find a skewness of close to zero, and a kurtosis of close to three.
(Note: While a normal distribution has kurtosis ˜ 3, other distributions can have a kurtosis of 3, and thus you cannot use kurtosis alone to test the likelihood that your sample was drawn from a normal distribution. Statisticians have devised numerous other normality tests.)
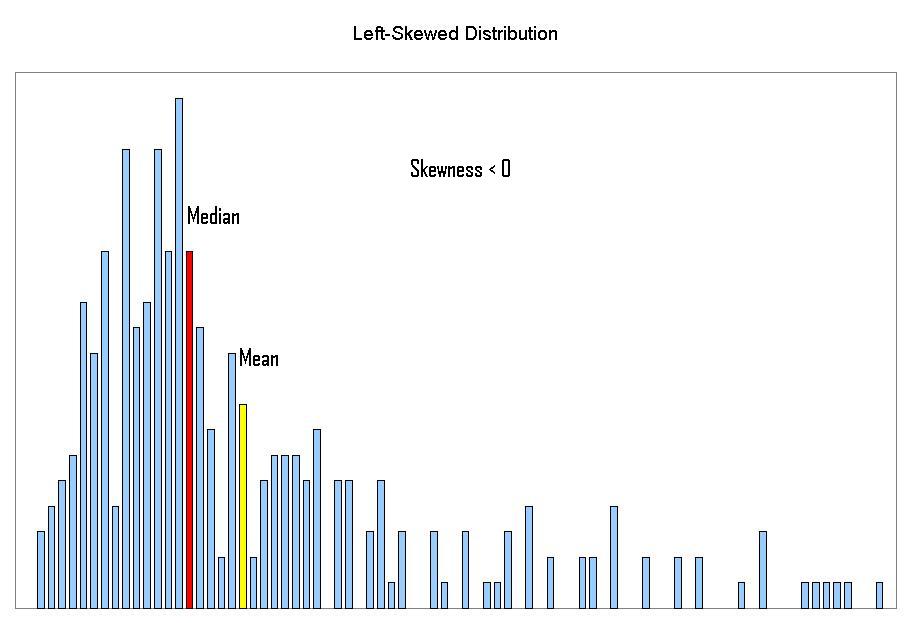
Data sets are sometimes asymmetrical. For example, for a left-skewed data set, the median will be lower than the mean, and the skewness will be negative, as seen in this chart:
![Left-Skewed Distribution]()
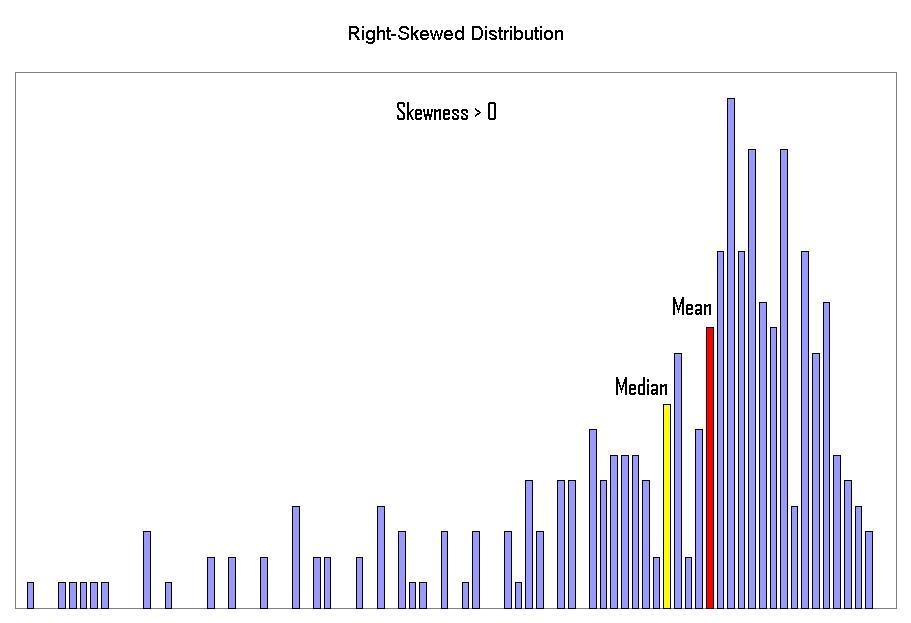
In right-skewed data sets, the median is greater than the mean, and the skewness is positive:
![Right-Skewed Distribution]()
In a high kurtosis distribution (kurtosis > 3), data will be clustered much more about the mean, and the tails will be relatively lighter. The chart below shows a distribution with a relatively high kurtosis (5.3); this distribution has a high proportion of its data points clustered about the mean, and the tails are very light:
![High Kurtosis Distribution]()
Among the commonly-encountered probability distributions described in statistics, the Bernoulli distribution (for probability close to 0% or 100%), Laplace distribution and the logistic distribution tend to have high kurtosis values.
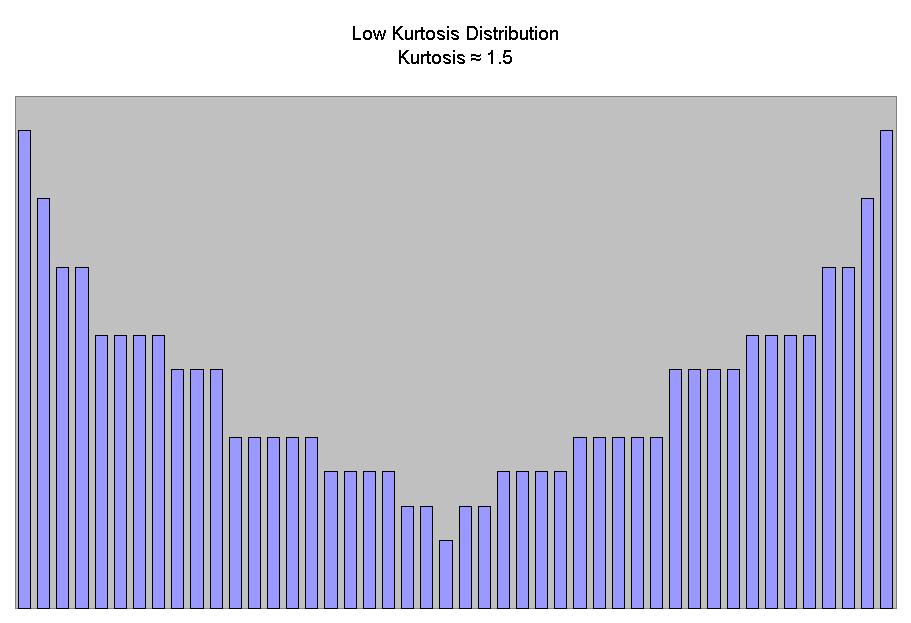
In a low kurtosis distribution (kurtosis < 3), data will not have a pronounced peak about the mean, and will consequently have heavier tails, The chart below shows a distribution with a relatively low kurtosis (1.5); this distribution has relatively few data points clustered about the mean, and the tails are very heavy:
![Low Kurtosis Distribution]()
Examples of probability distributions with low kurtosis values include the Bernoulli distribution (for probability close to 50%; p = 50% generates the lowest possible kurtosis value, 1), and the discrete uniform distribution.
The formulas for skewness and kurtosis are as follows:
![Skewness Formula]()
![Kurtosis Formua]()
You can compute both the skewness and the kurtosis using on SQL. However, as the following use cases demonstrate, the formulas are very complex.
For convenience, I created two user defined "domain aggregate" functions to compute these statistics, DSkewness and DKurtosis. Both functions take the following arguments:
For the Column and Tbl arguments, I strongly recommended that you place the column/table/query names in square brackets. This is mandatory if your database object names violate the usual naming rules, such as by including spaces, punctuation, keywords, etc.
The Source Code section to this article contains the VBA source code for the DSkewness and DKurtosis functions, and the sample database provided in the Sample Files section illustrates all four of the use cases described below.
The next four use cases all demonstrate use of the DSkewness and DKurtosis functions to simplify the SQL statements:
Below please find the VBA source code for the DMedian, DMode, DSkewness, and DKurtosis functions.
This article includes two sample files.
Access database
Stats-Part-1.mdb
Excel workbook
Stats-Article-Part-1.xls
To implement the DMedian, DMode, DSkewness, and/or DKurtosis functions in your Access projects, simply copy the source code listed for the desired functions(s) in this article, and paste the code into a regular VBA module in your Access project.
Once you have added the code to your Access project, you will be able to use the functions you added in queries, forms, reports, and in other VBA procedures in your project.
Notes:
As noted in the introduction, the focus of this article in on calculating the median, mode, skewness, and kurtosis statistics using Access, and thus I assume readers will have at least a working knowledge of what these statistics are and how to use them.
Readers wishing to learn more about these statistics, and statistical methods generally, may want to start a good general purpose introduction to probability and statistics. The following books generally get good reviews as introductory texts for people without advanced math backgrounds who need to understand basic statistics:
For people looking for a more rigorous treatment of statistics, you may want to pick up a used copy of a textbook from a college introductory level "Intro to Stats" course. I would have recommended my own textbook from back in the day, which I still refer to often, except that the latest edition is getting horrendous reviews.
For quick definitions and explanation of terms, it is difficult to beat Wikipedia. The following articles provide explanations for many of the statistical terms mentioned in this article:
Other sites that may be useful:
Beyond these, any search on "introduction to statistics" or "hypothesis" testing" on the major search engines will return thousands of hits.
=-=-=-=-=-=-=-=-=-=-=-=-=-=-=-=-=-=-=-=-=-=-=-=-=-=-=-=-=-=-=-=-=-=-=-=-=-=-=-=-=
If you liked this article and want to see more from this author, please click here.
If you found this article helpful, please click the Yes button near the:
Was this article helpful?
label that is just below and to the right of this text. Thanks!
=-=-=-=-=-=-=-=-=-=-=-=-=-=-=-=-=-=-=-=-=-=-=-=-=-=-=-=-=-=-=-=-=-=-=-=-=-=-=-=-=
Introduction
Like other database applications, Access provides support for computing basic descriptive statistics for a data set, offering such aggregate functions as Count, Sum, Min, Max, standard deviation and variance (StDev, StDevP, Var, and VarP), and average (Avg). In addition to these typical aggregate functions, Access also offers the so-called "domain aggregate" counterparts for each of the aggregates already mentioned.
That said, there are other useful descriptive statistics for data sets that Access does not support via native functions. This article will describe how to compute four additional descriptive statistics in Microsoft Access:
Median
Mode
Skewness
Kurtosis
In the next four sections below, this article will describe how to compute the median, mode, skewness, and kurtosis statistics in Access, using examples that I replicate in the attached sample files.
Where feasible, I demonstrate how to calculate these statistics using Jet SQL (Access's native SQL dialect).
I also demonstrate using user defined "domain aggregate" functions, developed in Visual Basic for Applications (VBA), to compute these statistics.
In the Source Code section of this article, I include the VBA source code for four user defined "domain aggregate" functions: DMedian, DMode, DSkewness, and DKurtosis.
This article's Sample Files section includes two sample files, demonstrating the techniques described here with a set of sample data.
In the next to last section, I describe how to implement these new functions in your Microsoft Access projects.
Finally, this article is intended to show you how to compute the median, mode, skewness, and kurtosis statistics using Access, and is not meant as a primer in the statistical constructs or methods themselves. For readers interested in learning more about the statistics themselves, and how they fit into statistical methods such as hypothesis testing, please see the Further Reading section.
Median
The median is a measure of central tendency that returns the "middle" value in an ordered set of data.
If there is an odd number of elements in the data set, then the median is that value for which the number of items preceding that value is equal to the number of items following that value:
If there is an even number of elements, then the median is the simple average of the two middle elements:
In symmetrical distributions, the mean and the median are typically close in value. However, in skewed distributions, or in samples with extreme outliers, the difference between the mean and the median can be significant.
Access does not provide a native function for determining the median, and writing a SQL query to return the median is a difficult proposition:
In order to calculate a median value using SQL, one must know how many records are in the applicable data set, and often times that result cannot be known without running a query.
Using a sub-query (whether directly in the SQL statement, or by reference as in a "two-step" query) will not work, as the SQL will require a "SELECT TOP N" clause, and Jet cannot accept a variable to define the "N" value. (Beginning with SQL Server 2005, Transact SQL can use a variable value in a "SELECT TOP N" clause.)
In addition, Jet will often return all of the items in a tie when you use "SELECT TOP N", thus making it difficult to use subqueries to find the median even if you knew the total number of rows ahead of time
Given these limitations, it is simply not feasible to rely on a pure SQL approach to calculate a median, and a VBA approach is preferred. For this purpose, I created the DMedian user defined function. It behaves similarly to Access's native domain aggregates, and takes the following arguments:
Column is the name of the column for which you want to find the median value
Tbl is the name of the table or query from which your data comes
Criteria (optional) defines any filtering criteria you wish to apply to the data. Be sure to use single quotes to qualify text values and # to qualify dates in the Criteria string
For the Column and Tbl arguments, I strongly recommended that you place the column/table/query names in square brackets. This is mandatory if your database object names violate the usual naming rules, such as by including spaces, punctuation, keywords, etc.
The Source Code section to this article contains the VBA source code for the DMedian function, and the sample database provided in the Sample Files section illustrates four use cases for DMedian on a set of sample data.
Median for all data, qryUDF_Median_All

                      SELECT DMedian("Value", "Sample") AS Median;

                      Returns:
                      Median
104Median by Code, qryUDF_Median_ByCode
SELECT Sample.Code, DMedian("Value","Sample","[Code] = '" & Code & "'") AS Median
FROM Sample
GROUP BY Sample.Code;
Returns:
Code Median
A 100
B 110.5
C 101.5Median by Section, qryUDF_Median_BySection
SELECT Sample.Section, DMedian("Value","Sample","[Section] = '" & Section & "'") AS Median
FROM Sample
GROUP BY Sample.Section;
Returns:
Section Median
Section 1 105.5
Section 2 103Median by Section and Code, qryUDF_Median_BySectionAndCode
SELECT Sample.Section, Sample.Code, DMedian("Value","Sample","[Section] = '" &
[Section] & "' And [Code] = '" & [Code] & "'") AS Median
FROM Sample
GROUP BY Sample.Section, Sample.Code;
Returns:
Section Code Median
Section 1 A 100
Section 1 B 112
Section 1 C 100
Section 2 A 100.5
Section 2 B 107
Section 2 C 103Mode
The mode is a measure of central tendency that returns the value(s) in the data set that appear most frequently. For example, in the data set below, the mode is 5:
In case more than one value is tied for the greatest frequency, the mode is considered the set of all such values. For example, in this data set, the mode equals 5 and 9:
Unlike the median, you can use regular SQL quite readily to calculate the mode, by using sub-queries. However, in cases where there is more than one value in the mode, a pure SQL-based approach will output each modal value on its own row. If instead you prefer to have all of the modal values in a single column on a single row, you must use VBA to create a user defined function. You may also find DMode more convenient to use, rather than working out the subquery logic, although the pure SQL approach will execute more quickly.
I created the DMode user defined function fot this purpose. It behaves similarly to Access's native domain aggregates, and takes the following arguments:
Column is the name of the column for which you want to find the mode value(s)
Tbl is the name of the table or query from which your data comes
Criteria (optional) defines any filtering criteria you wish to apply to the data. Be sure to use single quotes to qualify text values and # to qualify dates in the Criteria string
ReturnMode (optional) determines which values DMode returns. If omitted or zero, DMode returns a delimited list of all applicable modal values. If negative, DMode returns the modal value that is returned first in an ascending sort, and if positive, DMode returns the modal value that is returned first in an descending sort
Delimiter (optional) defines the delimiter to be used if the function is returning more than one modal value. By default, DMode uses a comma plus a space
For the Column and Tbl arguments, I strongly recommended that you place the column/table/query names in square brackets. This is mandatory if your database object names violate the usual naming rules, such as by including spaces, punctuation, keywords, etc.
The Source Code section to this article contains the VBA source code for the DMode function, and the sample database provided in the Sample Files section illustrates four use cases each for calculating modes using SQL and using DMedian.
The first four use cases illustrate a pure SQL approach to calculating the modes:
Mode for all data, SQL, qrySQL_Mode_All

                      SELECT TOP 1 Sample.Value
                      FROM Sample
                      GROUP BY Sample.Value
                      ORDER BY Count(Sample.Value) DESC;

                      Returns:
                      Value
                      80
99Mode by Code, SQL, qrySQL_Mode_ByCode
SELECT t1.Code, t1.Value
FROM Sample AS t1
WHERE t1.Value In
(SELECT TOP 1 t2.Value
FROM Sample t2
WHERE t2.Code = t1.Code
GROUP BY t2.Value
ORDER BY Count(t2.Value) Desc)
GROUP BY t1.Code, t1.Value;
Returns:
Code Value
A 99
A 105
B 115
C 71Mode by Section, SQL, qrySQL_Mode_BySection
SELECT t1.Section, t1.Value
FROM Sample AS t1
WHERE t1.Value In
(SELECT TOP 1 t2.Value
FROM Sample t2
WHERE t2.Section = t1.Section
GROUP BY t2.Value
ORDER BY Count(t2.Value) Desc)
GROUP BY t1.Section, t1.Value;
Returns:
Section Value
Section 1 80
Section 1 97
Section 1 99
Section 1 108
Section 2 104
Section 2 131
Section 2 140Mode by Section and Code, SQL, qrySQL_Mode_BySectionAndCode
SELECT t1.Section, t1.Code, t1.Value
FROM Sample AS t1
WHERE t1.Value In
(SELECT TOP 1 t2.Value
FROM Sample t2
WHERE t2.Section = t1.Section And t2.Code = t1.Code
GROUP BY t2.Value
ORDER BY Count(t2.Value) Desc)
GROUP BY t1.Section, t1.Code, t1.Value;
Returns:
Section Code Value
Section 1 A 99
Section 1 B 95
Section 1 B 114
Section 1 B 115
Section 1 B 116
Section 1 C 81
Section 1 C 108
Section 2 A 105
Section 2 B 123
Section 2 B 131
Section 2 B 140
Section 2 C 104The next four use cases all demonstrate use of the DMode function to simplify the SQL statements:
Mode for all data, UDF, qryUDF_Mode_All

                      SELECT DMode("Value","Sample") AS ModeAll, DMode("Value","Sample","",-1) AS ModeFirst,
                          DMode("Value","Sample","",1) AS ModeLast;

                      Returns:
                      ModeAll   ModeFirst   ModeLast
80, 99 80 99Mode by Code, UDF, qryUDF_Mode_ByCode
SELECT Sample.Code, DMode("Value","Sample","[Code] = '" & [Code] & "'") AS ModeAll,
DMode("Value","Sample","[Code] = '" & Code & "'",-1) AS ModeFirst,
DMode("Value","Sample","[Code] = '" & Code & "'",1) AS ModeLast
FROM Sample
GROUP BY Sample.Code;
Returns:
Code ModeAll ModeFirst ModeLast
A 105, 99 99 105
B 115 115 115
C 71 71 71Mode by Section, UDF, qryUDF_Mode_BySection
SELECT Sample.Section, DMode("Value","Sample","[Section] = '" & [Section] & "'") AS ModeAll,
DMode("Value","Sample","[Section] = '" & [Section] & "'",-1) AS ModeFirst,
DMode("Value","Sample","[Section] = '" & [Section] & "'",1) AS ModeLast
FROM Sample
GROUP BY Sample.Section;
Returns:
Section ModeAll ModeFirst ModeLast
Section 1 80, 97, 99, 108 80 108
Section 2 104, 131, 140 104 140Mode by Section and Code, UDF, qryUDF_Mode_BySectionAndCode
SELECT Sample.Section, Sample.Code,
DMode("Value","Sample","[Section] = '" & [Section] & "' And [Code] = '" & [Code] & "'") AS ModeAll,
DMode("Value","Sample","[Section] = '" & [Section] & "' And [Code] = '" & [Code] & "'",-1) AS ModeFirst,
DMode("Value","Sample","[Section] = '" & [Section] & "' And [Code] = '" & [Code] & "'",1) AS ModeLast
FROM Sample
GROUP BY Sample.Section, Sample.Code;
Returns:
Section Code ModeAll ModeFirst ModeLast
Section 1 A 99 99 99
Section 1 B 95, 114, 115, 116 95 116
Section 1 C 81, 108 81 108
Section 2 A 105 105 105
Section 2 B 123, 140, 131 123 140
Section 2 C 104 104 104Skewness and Kurtosis
Skewness and kurtosis describe the shape of your data set's distribution. Skewness indicates how symmetrical the data set is, while kurtosis indicates how heavy your data set is about its mean compared to its tails. Perfectly symmetrical data sets will have a skewness of zero, and a normally distributed data set will have a kurtosis of approximately three.
For example, this histogram (with an overlay of what a perfect normal distribution would have been) represents the total sample set available in the Access database included with this article:
As we can see, the sample set is reasonably symmetrical, and the overall distribution appears to be close to a normal distribution, and thus we would expect to find a skewness of close to zero, and a kurtosis of close to three.
(Note: While a normal distribution has kurtosis ˜ 3, other distributions can have a kurtosis of 3, and thus you cannot use kurtosis alone to test the likelihood that your sample was drawn from a normal distribution. Statisticians have devised numerous other normality tests.)
Data sets are sometimes asymmetrical. For example, for a left-skewed data set, the median will be lower than the mean, and the skewness will be negative, as seen in this chart:
In right-skewed data sets, the median is greater than the mean, and the skewness is positive:
In a high kurtosis distribution (kurtosis > 3), data will be clustered much more about the mean, and the tails will be relatively lighter. The chart below shows a distribution with a relatively high kurtosis (5.3); this distribution has a high proportion of its data points clustered about the mean, and the tails are very light:

Among the commonly-encountered probability distributions described in statistics, the Bernoulli distribution (for probability close to 0% or 100%), Laplace distribution and the logistic distribution tend to have high kurtosis values.
In a low kurtosis distribution (kurtosis < 3), data will not have a pronounced peak about the mean, and will consequently have heavier tails, The chart below shows a distribution with a relatively low kurtosis (1.5); this distribution has relatively few data points clustered about the mean, and the tails are very heavy:
Examples of probability distributions with low kurtosis values include the Bernoulli distribution (for probability close to 50%; p = 50% generates the lowest possible kurtosis value, 1), and the discrete uniform distribution.
The formulas for skewness and kurtosis are as follows:
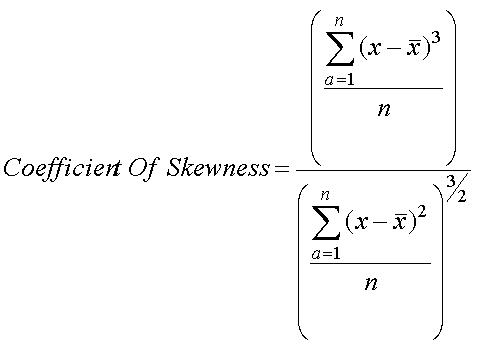
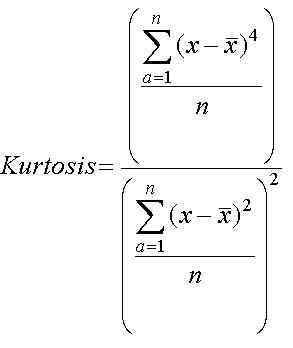
You can compute both the skewness and the kurtosis using on SQL. However, as the following use cases demonstrate, the formulas are very complex.
Skewness and kurtosis for all data, SQL, qrySQL_SkewKurt_All

                      SELECT (Sum((t2.Value-z.TheAvg)^3)/Count(t2.Value))/(Sum((t2.Value-z.TheAvg)^2)/Count(t2.Value))^1.5 AS Skewness,
                          (Sum((t2.Value-z.TheAvg)^4)/Count(t2.Value))/(Sum((t2.Value-z.TheAvg)^2)/Count(t2.Value))^2 AS Kurtosis
                      FROM Sample AS t2,
                          [SELECT Avg(t1.Value) AS TheAvg
                          FROM Sample t1]. AS z
                      HAVING Count(t2.Value) > 0;

                      Returns:
                      Skewness   Kurtosis
0.0672 3.0465Skewness and kurtosis by Code, SQL, qrySQL_SkewKurt_ByCode
SELECT t2.Code,
(Sum((t2.Value-z.TheAvg)^3)/Count(t2.Value))/(Sum((t2.Value-z.TheAvg)^2)/Count(t2.Value))^1.5 AS Skewness,
(Sum((t2.Value-z.TheAvg)^4)/Count(t2.Value))/(Sum((t2.Value-z.TheAvg)^2)/Count(t2.Value))^2 AS Kurtosis
FROM Sample AS t2 INNER JOIN
[SELECT t1.Code, Avg(t1.Value) AS TheAvg
FROM Sample t1 GROUP BY t1.Code]. AS z ON t2.Code = z.Code
GROUP BY t2.Code
HAVING Count(t2.Value) > 0;
Returns:
Code Skewness Kurtosis
A -0.0289 2.7148
B 0.1870 3.3675
C -0.0492 2.7303Skewness and kurtosis by Section, SQL, qrySQL_SkewKurt_BySection
SELECT t2.Section,
(Sum((t2.Value-z.TheAvg)^3)/Count(t2.Value))/(Sum((t2.Value-z.TheAvg)^2)/Count(t2.Value))^1.5 AS Skewness,
(Sum((t2.Value-z.TheAvg)^4)/Count(t2.Value))/(Sum((t2.Value-z.TheAvg)^2)/Count(t2.Value))^2 AS Kurtosis
FROM Sample AS t2 INNER JOIN
[SELECT t1.Section, Avg(t1.Value) AS TheAvg
FROM Sample t1 GROUP BY t1.Section]. AS z ON t2.Section = z.Section
GROUP BY t2.Section
HAVING Count(t2.Value) > 0;
Returns:
Section Skewness Kurtosis
Section 1 0.0605 3.0673
Section 2 0.0670 2.9209Skewness and kurtosis by Section and Code, SQL, qrySQL_SkewKurt_BySectionAndCode
SELECT t2.Section, t2.Code,
(Sum((t2.Value-z.TheAvg)^3)/Count(t2.Value))/(Sum((t2.Value-z.TheAvg)^2)/Count(t2.Value))^1.5 AS Skewness,
(Sum((t2.Value-z.TheAvg)^4)/Count(t2.Value))/(Sum((t2.Value-z.TheAvg)^2)/Count(t2.Value))^2 AS Kurtosis
FROM Sample AS t2 INNER JOIN
[SELECT t1.Section, t1.Code, Avg(t1.Value) AS TheAvg
FROM Sample t1 GROUP BY t1.Section, t1.Code]. AS z ON (t2.Section = z.Section) AND (t2.Code = z.Code)
GROUP BY t2.Section, t2.Code
HAVING Count(t2.Value) > 0;
Returns:
Section Code Skewness Kurtosis
Section 1 A -0.0673 2.6510
Section 1 B 0.1870 3.5337
Section 1 C 0.0235 2.5559
Section 2 A 0.0723 2.2061
Section 2 B 0.1778 2.8530
Section 2 C -0.1484 2.9293For convenience, I created two user defined "domain aggregate" functions to compute these statistics, DSkewness and DKurtosis. Both functions take the following arguments:
Column is the name of the column for which you want to find the skewness or kurtosis value
Tbl is the name of the table or query from which your data comes
Criteria (optional) defines any filtering criteria you wish to apply to the data. Be sure to use single quotes to qualify text values and # to qualify dates in the Criteria string
For the Column and Tbl arguments, I strongly recommended that you place the column/table/query names in square brackets. This is mandatory if your database object names violate the usual naming rules, such as by including spaces, punctuation, keywords, etc.
The Source Code section to this article contains the VBA source code for the DSkewness and DKurtosis functions, and the sample database provided in the Sample Files section illustrates all four of the use cases described below.
The next four use cases all demonstrate use of the DSkewness and DKurtosis functions to simplify the SQL statements:
Skewness and kurtosis for all data, UDF, qryUDF_SkewKurt_All

                      SELECT DSkewness("Value", "Sample") AS Skewness, DKurtosis("Value", "Sample") AS Kurtosis;

                      Returns:
                      Skewness   Kurtosis
0.0672 3.0465Skewness and kurtosis by Code, UDF, qryUDF_SkewKurt_ByCode
SELECT Sample.Code, DSkewness("Value","Sample","[Code] = '" & Code & "'") AS Skewness,
DKurtosis("Value","Sample","[Code] = '" & [Code] & "'") AS Kurtosiss
FROM Sample
GROUP BY Sample.Code;
Returns:
Code Skewness Kurtosis
A -0.0289 2.7148
B 0.1870 3.3675
C -0.0492 2.7303Skewness and kurtosis by Section, UDF, qryUDF_SkewKurt_BySection
SELECT Sample.Section, DSkewness("Value","Sample","[Section] = '" & [Section] & "'") AS Skewness,
DKurtosis("Value","Sample","[Section] = '" & [Section] & "'") AS Kurtosiss
FROM Sample
GROUP BY Sample.Section;
Returns:
Section Skewness Kurtosis
Section 1 0.0605 3.0673
Section 2 0.0670 2.9209Skewness and kurtosis by Section and Code, UDF, qryUDF_SkewKurt_BySectionAndCode
SELECT Sample.Section, Sample.Code,
DSkewness("Value","Sample","[Section] = '" & [Section] & "' And [Code] = '" & [Code] & "'") AS Skewness,
DKurtosis("Value","Sample","[Section] = '" & [Section] & "' And [Code] = '" & [Code] & "'") AS Kurtosiss
FROM Sample
GROUP BY Sample.Section, Sample.Code;
Returns:
Section Code Skewness Kurtosis
Section 1 A -0.0673 2.6510
Section 1 B 0.1870 3.5337
Section 1 C 0.0235 2.5559
Section 2 A 0.0723 2.2061
Section 2 B 0.1778 2.8530
Section 2 C -0.1484 2.9293Source Code
Below please find the VBA source code for the DMedian, DMode, DSkewness, and DKurtosis functions.
Function DMedian(Column As String, Tbl As String, Optional Criteria As String = "")

                          ' Function by Patrick G. Matthews

                          ' Feel free to use and distribute this code, so long as you credit authorship and indicate the
                          ' URL where you found it

                          ' This function calculates the median for a specified column from a specified table/query,
                          ' applying filtering as defined in the Criteria argument.  It is intended for use in Microsoft
                          ' Access.  This function requires a reference to the Microsoft DAO library.

                          ' Records with null values in the specified column are ignored

                          ' This function is labeled according to the domain aggregate function naming convention as it
                          ' behaves similarly to the other domain aggregates

                          ' Column is the column for which you want to determine the median
                          ' Tbl is the source table or query for the data
                          ' Criteria defines any filtering criteria you wish to apply to the data set.  Be sure to enclose
                          '       text items in single quotes and date values in the # date qualifiers

                          Dim rs As DAO.Recordset
                          Dim SQL As String
                          Dim Count As Long
                          Dim ValueNum As Long
                          Dim Counter As Long

                          Static Alias As String

                          On Error GoTo ErrHandler

                          ' The subquery needs an alias.  By creating a random string of 20 characters, it is virtually impossible
                          ' that the alias will duplicate a table name already used in the function call.  Since there is no need
                          ' to keep recreating this random string, it is a static variable and thus retains its state between calls

                          If Alias = "" Then
                              Randomize
                              ' Build 20-character string using A-Z
                              For Counter = 1 To 20
                                  Alias = Alias & Chr(65 + Int(Rnd * 26))
                              Next
                          End If

                          ' Initialize return value to null

                          DMedian = Null

                          ' Determine how many records exist for the set we calculate a median for

                          SQL = "SELECT Count(1) AS TheCount " & _
                              "FROM " & Tbl & " " & _
                              "WHERE " & IIf(Trim(Criteria) <> "", Criteria & " And ", "") & Column & " Is Not Null"

                          Set rs = CurrentDb.OpenRecordset(SQL, dbOpenSnapshot)

                          Count = rs!TheCount

                          ' ValueNum helps us determine where the "middle" of the set is

                          ValueNum = Int(Count / 2) + 1

                          rs.Close

                          ' For an odd number of records, grabbing the median is simple using a subquery.  The subquery
                          ' returns the top N records, and then the main query re-sorts that set in descending order
                          ' and returns the top-most  record

                          If Count > 0 And (Count Mod 2) = 1 Then
                              SQL = "SELECT TOP 1 " & Alias & "." & Column & " AS Median " & _
                                  "FROM " & _
                                      "(SELECT TOP " & ValueNum & " " & Column & " " & _
                                      "FROM " & Tbl & " " & _
                                      "WHERE " & IIf(Trim(Criteria) <> "", Criteria & " And ", "") & Column & " Is Not Null " & _
                                      "ORDER BY " & Column & " Asc) AS " & Alias & " " & _
                                  "ORDER BY " & Alias & "." & Column & " Desc"
                              Set rs = CurrentDb.OpenRecordset(SQL, dbOpenSnapshot)
                              DMedian = rs!median
                              rs.Close

                          ' For an even number of records, we have a problem.  We need to average the two middle values,
                          ' but the subquery approach will not work because in a "SELECT TOP N" query Access returns
                          ' ties.  Instead, initialize DMedian to 0, and step through the recordset.  Add together the
                          ' values from the two middle records, and then divide by two for the answer

                          ElseIf Count > 0 Then
                              SQL = "SELECT TOP " & ValueNum & " " & Column & " " & _
                                  "FROM " & Tbl & " " & _
                                  "WHERE " & IIf(Trim(Criteria) <> "", Criteria & " And ", "") & Column & " Is Not Null " & _
                                  "ORDER BY " & Column & " Asc"
                              Set rs = CurrentDb.OpenRecordset(SQL, dbOpenSnapshot)
                              Counter = 1
                              DMedian = 0
                              Do Until Counter > ValueNum Or rs.EOF
                                  If Counter = (ValueNum - 1) Or Counter = ValueNum Then
                                      DMedian = DMedian + rs.Fields(0).Value
                                  End If
                                  rs.MoveNext
                                  Counter = Counter + 1
                              Loop
                              rs.Close
                              DMedian = DMedian / 2
                          End If

                          GoTo Cleanup

                      ErrHandler:
                          DMedian = CVErr(Err.Number)

                      Cleanup:
                          Set rs = Nothing

End FunctionFunction DMode(Column As String, Tbl As String, Optional Criteria As String = "", _
Optional ReturnMode As Long = 0, Optional Delimiter As String = ", ")
' Function by Patrick G. Matthews
' Feel free to use and distribute this code, so long as you credit authorship and indicate the
' URL where you found it
' This function calculates the mode for a specified column from a specified table/query,
' applying filtering as defined in the Criteria argument. It is intended for use in Microsoft
' Access. This function requires a reference to the Microsoft DAO library.
' Records with null values in the specified column are ignored
' This function is labeled according to the domain aggregate function naming convention as it
' behaves similarly to the other domain aggregates
' Column is the column for which you want to determine the median
' Tbl is the source table or query for the data
' Criteria defines any filtering criteria you wish to apply to the data set. Be sure to enclose
' text items in single quotes and date values in the # date qualifiers
' ReturnMode indicates which modal value is returned.
' If 0 or omitted, all modal values are returned in a delimited list
' If negative, returns the modal value returned first in an ascending sort
' If positive, returns the modal value returned first in a descending sort
' Delimiter is the delimiter used in making a list of modal values. Default is ,+space
Dim rs As DAO.Recordset
Dim SQL As String
On Error GoTo ErrHandler
' Build up the SQL statement, then open recordset
SQL = "SELECT TOP 1 " & Column & " " & _
"FROM " & Tbl & " " & _
"WHERE " & IIf(Trim(Criteria) <> "", Criteria & " And ", "") & Column & " Is Not Null " & _
"GROUP BY " & Column & " " & _
"ORDER BY Count(1) Desc" & Switch(ReturnMode = 0, "", ReturnMode < 0, ", " & Column & " Asc", _
ReturnMode > 0, ", " & Column & " Desc")
Set rs = CurrentDb.OpenRecordset(SQL, dbOpenSnapshot)
' If ReturnMode = 0, function returns delimited list of all modal values
If ReturnMode = 0 Then
DMode = ""
Do Until rs.EOF
DMode = DMode & Delimiter & rs.Fields(0).Value
rs.MoveNext
Loop
DMode = Mid(DMode, Len(Delimiter) + 1)
' If ReturnMode is negative, function returns the modal value that sorts first ascending, and if
' ReturnMode is positive, function returns the modal value that sorts first descending
Else
DMode = rs.Fields(0).Value
End If
GoTo Cleanup
ErrHandler:
DMode = CVErr(Err.Number)
Cleanup:
Set rs = Nothing
End FunctionFunction DSkewness(Column As String, Tbl As String, Optional Criteria As String = "")
' Function by Patrick G. Matthews
' Feel free to use and distribute this code, so long as you credit authorship and indicate the
' URL where you found it
' This function calculates the sample skewness for a specified column from a specified
' table/query, applying filtering as defined in the Criteria argument. It is intended for use
' in Microsoft Access. This function requires a reference to the Microsoft DAO library.
' Records with null values in the specified column are ignored
' This function is labeled according to the domain aggregate function naming convention as it
' behaves similarly to the other domain aggregates
' Column is the column for which you want to determine the median
' Tbl is the source table or query for the data
' Criteria defines any filtering criteria you wish to apply to the data set. Be sure to enclose
' text items in single quotes and date values in the # date qualifiers
Dim rs As DAO.Recordset
Dim SQL As String
Dim Counter As Long
Static Alias As String
On Error GoTo ErrHandler
' The subquery needs an alias. By creating a random string of 20 characters, it is virtually impossible
' that the alias will duplicate a table name already used in the function call. Since there is no need
' to keep recreating this random string, it is a static variable and thus retains its state between calls
If Alias = "" Then
Randomize
' Build 20-character string using A-Z
For Counter = 1 To 20
Alias = Alias & Chr(65 + Int(Rnd * 26))
Next
End If
' Build up SQL statement
SQL = "SELECT (Sum((" & Column & " - " & Alias & ".TheAvg) ^ 3) / Count(" & Column & ")) / " & _
"(Sum((" & Column & " - " & Alias & ".TheAvg) ^ 2) / Count(" & Column & ")) ^ 1.5 AS Skew " & _
"FROM " & Tbl & ", " & _
"(SELECT Avg(" & Column & ") AS TheAvg, StDev(" & Column & ") AS TheStDev " & _
"FROM " & Tbl & " " & _
"WHERE " & IIf(Trim(Criteria) <> "", Criteria & " And ", "") & Column & " Is Not Null) AS " & Alias & " " & _
"WHERE " & IIf(Trim(Criteria) <> "", Criteria & " And ", "") & Column & " Is Not Null " & _
"HAVING Count(" & Column & ") > 2 and " & Alias & ".TheStDev <> 0"
Set rs = CurrentDb.OpenRecordset(SQL, dbOpenSnapshot)
If Not rs.EOF Then
DSkewness = rs!Skew
Else
DSkewness = Null
End If
rs.Close
GoTo Cleanup
ErrHandler:
DSkewness = CVErr(Err.Number)
Cleanup:
Set rs = Nothing
End FunctionFunction DKurtosis(Column As String, Tbl As String, Optional Criteria As String = "")
' Function by Patrick G. Matthews
' Feel free to use and distribute this code, so long as you credit authorship and indicate the
' URL where you found it
' This function calculates the sample kurtosis for a specified column from a specified
' table/query, applying filtering as defined in the Criteria argument. It is intended for use
' in Microsoft Access. This function requires a reference to the Microsoft DAO library.
' Records with null values in the specified column are ignored
' This function is labeled according to the domain aggregate function naming convention as it
' behaves similarly to the other domain aggregates
' Column is the column for which you want to determine the median
' Tbl is the source table or query for the data
' Criteria defines any filtering criteria you wish to apply to the data set. Be sure to enclose
' text items in single quotes and date values in the # date qualifiers
Dim rs As DAO.Recordset
Dim SQL As String
Dim Counter As Long
Static Alias As String
On Error GoTo ErrHandler
' The subquery needs an alias. By creating a random string of 20 characters, it is virtually impossible
' that the alias will duplicate a table name already used in the function call. Since there is no need
' to keep recreating this random string, it is a static variable and thus retains its state between calls
If Alias = "" Then
Randomize
' Build 20-character string using A-Z
For Counter = 1 To 20
Alias = Alias & Chr(65 + Int(Rnd * 26))
Next
End If
' Build up SQL statement
SQL = "SELECT (Sum((" & Column & " - " & Alias & ".TheAvg) ^ 4) / Count(" & Column & ")) / " & _
"(Sum((" & Column & " - " & Alias & ".TheAvg) ^ 2) / Count(" & Column & ")) ^ 2 AS Skew " & _
"FROM " & Tbl & ", " & _
"(SELECT Avg(" & Column & ") AS TheAvg, StDev(" & Column & ") AS TheStDev " & _
"FROM " & Tbl & " " & _
"WHERE " & IIf(Trim(Criteria) <> "", Criteria & " And ", "") & Column & " Is Not Null) AS " & Alias & " " & _
"WHERE " & IIf(Trim(Criteria) <> "", Criteria & " And ", "") & Column & " Is Not Null " & _
"HAVING Count(" & Column & ") > 3 and " & Alias & ".TheStDev <> 0"
Set rs = CurrentDb.OpenRecordset(SQL, dbOpenSnapshot)
If Not rs.EOF Then
DKurtosis = rs!Skew
Else
DKurtosis = Null
End If
rs.Close
GoTo Cleanup
ErrHandler:
DKurtosis = CVErr(Err.Number)
Cleanup:
Set rs = Nothing
End FunctionSample Files
This article includes two sample files.
Access database
Single table, "Sample", containing the data used for example queries and results in this article
20 queries demonstrating the techniques described in this article
VBA source code for the DMedian, DMode, DSkewness, and DKurtosis functions
Stats-Part-1.mdb
Excel workbook
Single worksheet containing the same data as in the Access database
Sample statistics for the whole data set plus subsets corresponding to those in Access
Note: Excel's kurtosis calculation is scaled differently than the kurtosis calculated in the examples in this article and in the Access database. Excel reports the "excess kurtosis", for which a normal distribution would have a value of approximately zero
Stats-Article-Part-1.xls
Implementing DMedian, DMode, DSkewness, and DKurtosis in Your Access Projects
To implement the DMedian, DMode, DSkewness, and/or DKurtosis functions in your Access projects, simply copy the source code listed for the desired functions(s) in this article, and paste the code into a regular VBA module in your Access project.
Once you have added the code to your Access project, you will be able to use the functions you added in queries, forms, reports, and in other VBA procedures in your project.
Notes:
To reach the Visual Basic editor from Access, use Alt+F11
Be sure to post the code in a "regular" module, and not a class module, form module, or report module
Make sure that the module name does not match any of the sub or function names in that module
Further Reading
As noted in the introduction, the focus of this article in on calculating the median, mode, skewness, and kurtosis statistics using Access, and thus I assume readers will have at least a working knowledge of what these statistics are and how to use them.
Readers wishing to learn more about these statistics, and statistical methods generally, may want to start a good general purpose introduction to probability and statistics. The following books generally get good reviews as introductory texts for people without advanced math backgrounds who need to understand basic statistics:
Statistics Without Tears: A Primer for Non-Mathematicians, by Derek Rowntree
Statistics for Dummies, by Deborah Rumsey
The Complete Idiot's Guide to Statistics, by Robert A. Donnelly
For people looking for a more rigorous treatment of statistics, you may want to pick up a used copy of a textbook from a college introductory level "Intro to Stats" course. I would have recommended my own textbook from back in the day, which I still refer to often, except that the latest edition is getting horrendous reviews.
For quick definitions and explanation of terms, it is difficult to beat Wikipedia. The following articles provide explanations for many of the statistical terms mentioned in this article:
The probability distributions mentioned in this article: Normal distribution, Bernoulli distribution, Laplace distribution, logistic distribution, and discrete uniform distribution
Hypothesis testing in general
Other sites that may be useful:
Beyond these, any search on "introduction to statistics" or "hypothesis" testing" on the major search engines will return thousands of hits.
=-=-=-=-=-=-=-=-=-=-=-=-=-
If you liked this article and want to see more from this author, please click here.
If you found this article helpful, please click the Yes button near the:
Was this article helpful?
label that is just below and to the right of this text. Thanks!
=-=-=-=-=-=-=-=-=-=-=-=-=-
Have a question about something in this article? You can receive help directly from the article author. Sign up for a free trial to get started.
Comments (7)
Commented:
Commented:
You fired up a recordset to get the count.
Why not just use a Move to get to the middle, or middle two?
'ok if rs.recordcount is odd then things are easy
If rs.RecordCount Mod 2 = 1 Then
'odd number
rs.Move ((rs.RecordCount - 1) / 2)
MedianValue = rs(FieldName)
Else
rs.Move ((rs.RecordCount - 2) / 2)
MedianValue = rs(FieldName)
rs.MoveNext
MedianValue = MedianValue + rs(FieldName)
MedianValue = MedianValue / 2
End If
The overhead of the recordset has been incurred, why flop back to SQL to get the values?
Just asking.
Commented:
I need to find the median of a calculated field in my table. I get an error when using the calculated field and confirmed in your own file that when using a calculated field as the value it will always return an error? Do you know if there is any easy fix for this? I tried looking at your code but I'm not sure where to start.
Thanks,
Miles
Commented:
Commented:
View More