

Browse All Articles > PHP - Code Profiling and Analyzing Performance
Let's say you have a PHP script that is performing slow. You've gone through all the steps you can think of to figure out what is wrong, or it's just too complex of an application. You need help, and it not only exists, but it's fairly easy to get!
The solution here is called cachegrind. It's a bit of an obscure name, but stems from how it was originally used. The concept is that you can have PHP (via an extension called XDebug) keep track of how long it took for every single line of code in a script to run, and to dump that information into a specially-formatted file called a cachegrind file. The script itself should run exactly as you would normally run it, so that the profiling process is virtually invisible.
This resulting cachegrind file is pretty difficult to read without any sort of tools, so we use some existing, free tools to read the cachegrind files for us and present a much easier-to-use interface for seeing how our script performed.
It's a very simple process and can be set up from beginning to end in 3 steps:
For Linux platforms, read this page:
http://www.xdebug.org/docs/install
For Windows platforms, just copy and paste the phpinfo() screen contents into this page:
http://www.xdebug.org/wizard.php
...and you'll get the exact instructions of what you need to do.
Also, set up your php.ini file with a few options to enable you to turn on profiling on demand and where to put the files that will be generated. My php.ini file on Windows looks like this:
xdebug.profiler_enable_trigger=1
xdebug.profiler_output_dir=D:\Temp
On Linux, it would look like:
xdebug.profiler_enable_trigger=1
xdebug.profiler_output_dir=/tmp
Make sure you restart your web server/service after changing the php.ini file!
http://www.mysite.com/script.php?something=abc
You would simply append the XDEBUG_PROFILE parameter like this:
http://www.mysite.com/script.php?something=abc&XDEBUG_PROFILE=1
That triggers the code profiler to start. When the script ends, you will have a cachegrind-compatible file ready for analyzing. In my case, I accessed:
http://localhost/date.php?XDEBUG_PROFILE=1
...and ended up with:
D:\Temp\cachegrind.out.8392 (because 8392 was the process ID)
Each application will have a different layout, but each application should give you the ability to view the amount of time that each step took - both the individual call time and the time it took for that section to complete. For example, if your script includes a file that connects to a database, you should see a small amount of time (a couple of milliseconds) to include the file, and a cumulatively larger amount of time that it took overall because of the database connection.
You can use a treeview-like interface to drill down into each section of code to gain more insight into where any performance bottlenecks might be occurring.
Here is a screenshot of a sample application with millions of lines of code that was profiled in a matter of seconds:
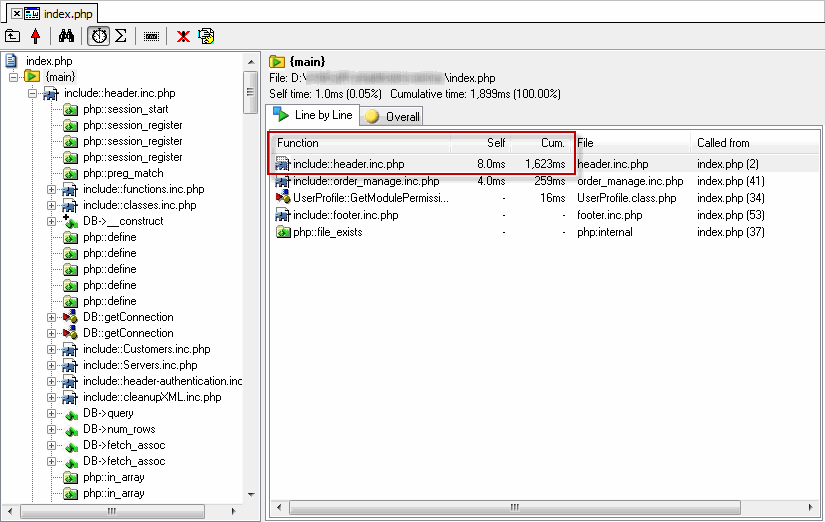
You'll see the treeview navigation on the left that allows me to drill down into any particular section of the code flow. I've selected the {main} section on that left side to see the top-level details of my script so I can see where the major bottlenecks are.
On the right side, I can see that while including the header.inc.php file only took 8 milliseconds, something inside the header.inc.php file took a whopping 1.6 seconds to run! So if I navigate to the header.inc.php node on the left navigation pane, I can then see a breakdown of that time:
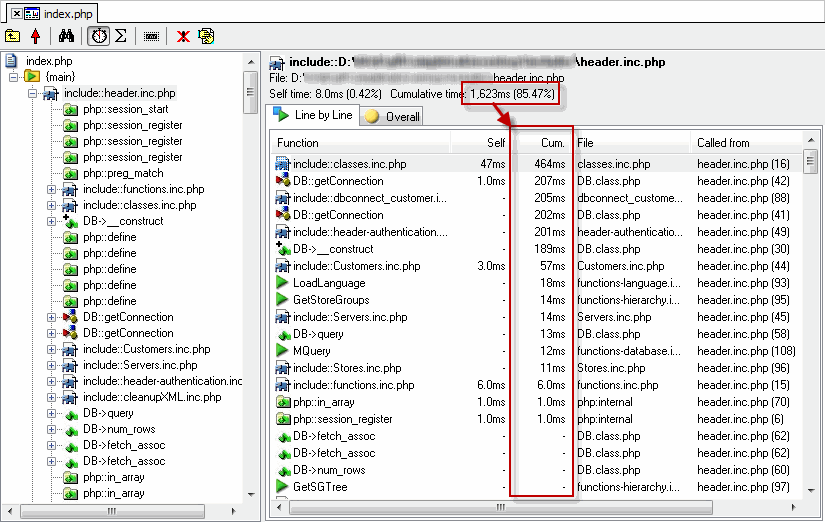
I can continue to drill down into each node if I want to keep getting further details about the performance, until I've learned exactly which line of code is responsible for the slowdowns. In the above examples, the slowdowns happen to be related to database connections.
Main Documentation Page:
http://www.xdebug.org/docs/
Profiling Page:
http://www.xdebug.org/docs/profiler
Copyright © 2013 - Jonathan Hilgeman. All Rights Reserved.
The solution here is called cachegrind. It's a bit of an obscure name, but stems from how it was originally used. The concept is that you can have PHP (via an extension called XDebug) keep track of how long it took for every single line of code in a script to run, and to dump that information into a specially-formatted file called a cachegrind file. The script itself should run exactly as you would normally run it, so that the profiling process is virtually invisible.
This resulting cachegrind file is pretty difficult to read without any sort of tools, so we use some existing, free tools to read the cachegrind files for us and present a much easier-to-use interface for seeing how our script performed.
It's a very simple process and can be set up from beginning to end in 3 steps:
Step 1: Install XDebug
Fear not, this is always the most complex stage, but it's not too bad. There is plenty of documentation available and a lot of help available if you ask for it!For Linux platforms, read this page:
http://www.xdebug.org/docs/install
For Windows platforms, just copy and paste the phpinfo() screen contents into this page:
http://www.xdebug.org/wizard.php
...and you'll get the exact instructions of what you need to do.
Also, set up your php.ini file with a few options to enable you to turn on profiling on demand and where to put the files that will be generated. My php.ini file on Windows looks like this:
xdebug.profiler_enable_trigger=1
xdebug.profiler_output_dir=D:\Temp
On Linux, it would look like:
xdebug.profiler_enable_trigger=1
xdebug.profiler_output_dir=/tmp
Make sure you restart your web server/service after changing the php.ini file!
Step 2: Generate the Code Profile
Once XDebug is installed per step 1, all you have to do is run your script and pass XDEBUG_PROFILE=1 as a query parameter. For example, let's say your normal script is accessed like this:http://www.mysite.com/script.php?something=abc
You would simply append the XDEBUG_PROFILE parameter like this:
http://www.mysite.com/script.php?something=abc&XDEBUG_PROFILE=1
That triggers the code profiler to start. When the script ends, you will have a cachegrind-compatible file ready for analyzing. In my case, I accessed:
http://localhost/date.php?XDEBUG_PROFILE=1
...and ended up with:
D:\Temp\cachegrind.out.8392 (because 8392 was the process ID)
Step 3: Analyze the Results
Open up KCacheGrind or WinCacheGrind or MacCallGrind (or whatever application you are using to analyze the file) and tell it to load that file.Each application will have a different layout, but each application should give you the ability to view the amount of time that each step took - both the individual call time and the time it took for that section to complete. For example, if your script includes a file that connects to a database, you should see a small amount of time (a couple of milliseconds) to include the file, and a cumulatively larger amount of time that it took overall because of the database connection.
You can use a treeview-like interface to drill down into each section of code to gain more insight into where any performance bottlenecks might be occurring.
Here is a screenshot of a sample application with millions of lines of code that was profiled in a matter of seconds:
You'll see the treeview navigation on the left that allows me to drill down into any particular section of the code flow. I've selected the {main} section on that left side to see the top-level details of my script so I can see where the major bottlenecks are.
On the right side, I can see that while including the header.inc.php file only took 8 milliseconds, something inside the header.inc.php file took a whopping 1.6 seconds to run! So if I navigate to the header.inc.php node on the left navigation pane, I can then see a breakdown of that time:
I can continue to drill down into each node if I want to keep getting further details about the performance, until I've learned exactly which line of code is responsible for the slowdowns. In the above examples, the slowdowns happen to be related to database connections.
Other Options
XDebug has a LOT of options and features beyond cachegrind code profiling, so it would be impractical to cover them all here. Make sure you check out their main documentation page for additional help and examples!Main Documentation Page:
http://www.xdebug.org/docs/
Profiling Page:
http://www.xdebug.org/docs/profiler
Copyright © 2013 - Jonathan Hilgeman. All Rights Reserved.
Have a question about something in this article? You can receive help directly from the article author. Sign up for a free trial to get started.
Comments (1)
Commented:
I've installed and added this to my php.ini file and restarted apache.
Open in new window