Improving Productivity using the Lamberts Conformal Conic Projection for Spatial Data Management in ESRI ArcGIS


Published:
Browse All Articles > Improving Productivity using the Lamberts Conformal Conic Projection for Spatial Data Management in ESRI ArcGIS
Introduction
This article is designed to assist GIS (Geographic Information System) and GPS (Global Positioning System) developers using ESRI ArcGIS and other spatial information management systems.For the uninitiated the concept of projections and their use in GIS can be a confusing subject area, especially when raster and vector data types fail to align. Projections are simply mathematical transformations that enable representation of 3D coordinate systems into 2D coordinate systems.
In relation to GIS and mapping this takes data managed in latitude and longitude and converts it to a more usable resource, such as a flat map which aims to accurately represent shape and area. Essentially the degrees based system of measurement is commonly migrated to a metric system such as metres. This enables you to effectively navigate terrain, or in the case of GIS, enable you to align raster and vector data or capture point, line and polygon features.
The Lamberts Conformal Conic projection
The Lamberts Conformal Conic (LCC) projection system was developed in the 18th century by a swiss mathematician named Johann Heinrich Lambert. The formulas behind the transformation would be interesting to some, but is not the primary focus of this article. What is important here is how we can implement this projection to improve spatial data management productivity.Datums, spheroids and zone based data management
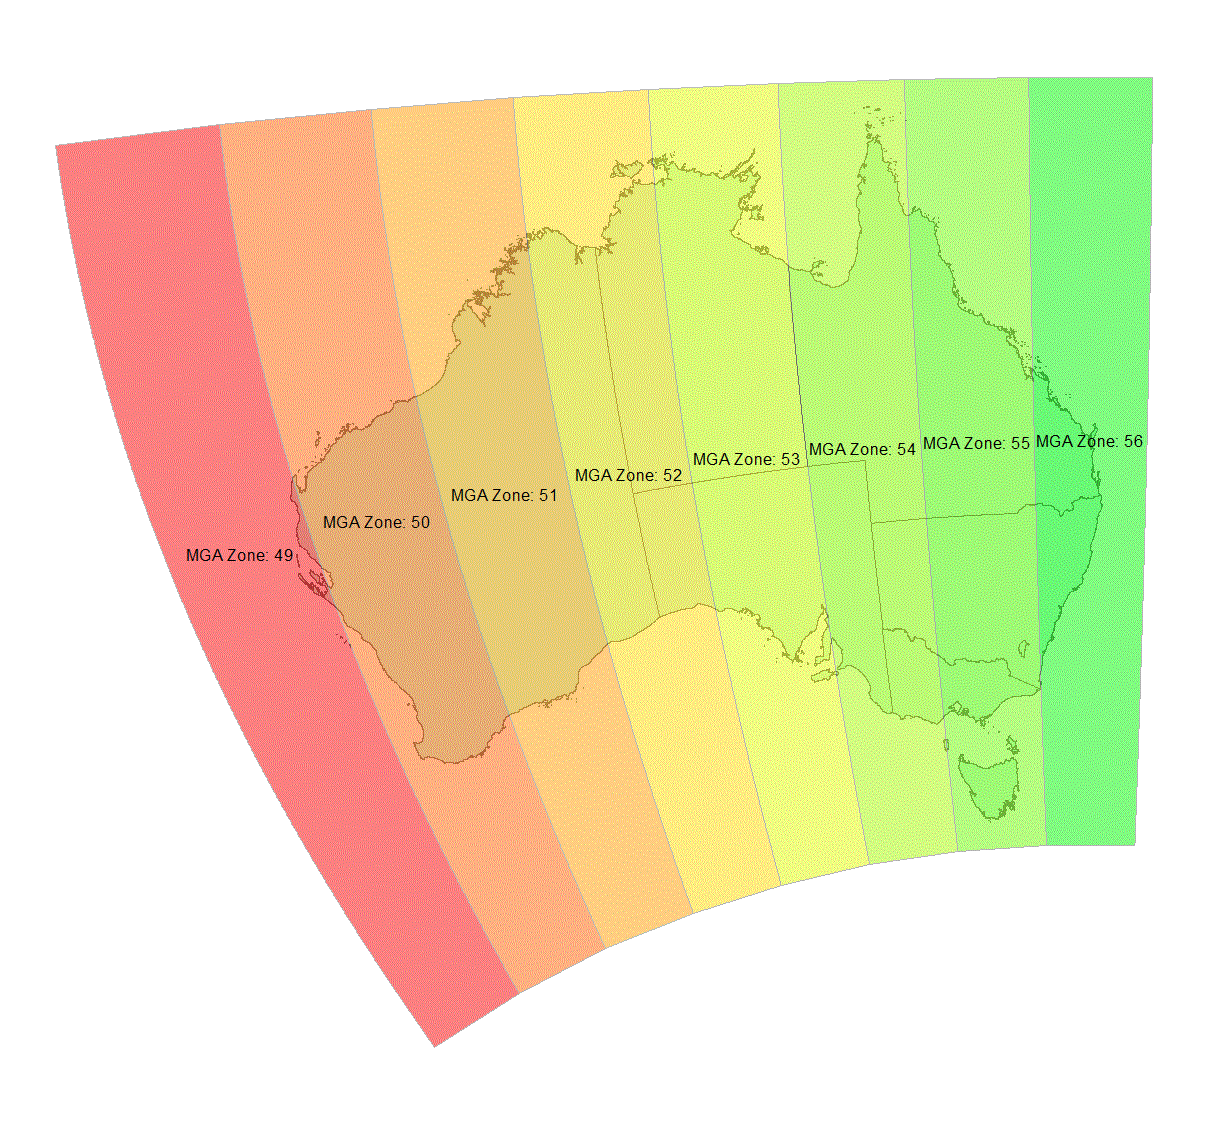
Often data is managed based on projected Universal Transverse Mercator (UTM) zones defined by the WGS84 (World Geographic Spheroid) datum. The datum itself is merely a set of values that are used to define a specific geodetic system, and is the same datum that GPS satellites use. In Australia, our datum is the Geocentric Datum of Australia (GDA94) , which is a localised version, that was defined in 1994. It has been closely aligned with WGS84 that enables capture of spatial data direct from satellites without the need to perform complex geospatial transformations.The zone system used is similar to UTM and is based on 60 zones of 6 degrees each. These zones are referred to as the Map Grid of Australia. The zones that start at 49 in the west and finish at 57 in the east if you include Lord Howe Island.
The issue with zone based spatial data management
While zone based spatial data management is fine for accurately representing features in terms of their area or length, it can also increase workload and cause spatial operator downtime. Each zone has an invisible boundary that does not make allowances for real world scenarios.For example if you were to calculate the area of a lake that is divided by a zone, you generally need to do it using two or more processes. This is because once you breach the extent of the zone, where distortion increases significantly and and differences in area or length calculations begin to occur. The distortion will increase the overall perimeter or area of line or polygon calculations the further you travel from the zone extent. If the data are to be used for subsequent geoprocessing tasks all products will inherit the error. This type of error looks more significant if you present it across all zones as shown in the image below.
Implementing LCC to resolve calculation issues
The lamberts system does not suffer from these distortion based issues, particularly where east-west elongation is an issue, such as in Australia. This projected coordinate system, when based on the GDA94 datum, enables spatial operators to capture and manage data in a single layer at local, regional or national scales.ESRI ArcGIS integration
ESRI ArcGIS maintains details of the more than 4000 projections managed by the OGP (International Association of Oil and Gas Producers), formerly known as the European Petroleum Survey Group (EPSG) that was founded in 1986. The critical component of this resource is the underlying datum, upon which all coordinate calculations are based. In ArcGIS the projection file (*.prj) is used to maintain this information. This information is used by ArcGIS and other spatial applications to make decisions about where to put your data. The ArcMap application "projects on the fly" when the projection is defined, enabling alignment of raster and vector data with minimal user interaction. The benefits are less confusion and increased productivity. A sample Lamberts projection file (*.prj) is displayed below;PROJCS["GDA_1994_Geoscience_Australia_Lambert",
GEOGCS["GCS_GDA_1994",
DATUM["D_GDA_1994",
SPHEROID["GRS_1980",6378137.0,298.257222101]],
PRIMEM["Greenwich",0.0],
UNIT["Degree",0.0174532925199433]],
PROJECTION["Lambert_Conformal_Conic"],
PARAMETER["False_Easting",0.0],
PARAMETER["False_Northing",0.0],
PARAMETER["Central_Meridian",134.0],
PARAMETER["Standard_Parallel_1",-18.0],
PARAMETER["Standard_Parallel_2",-36.0],
PARAMETER["Latitude_Of_Origin",0.0],
UNIT["Meter",1.0],
AUTHORITY["EPSG",3112]]Implementing LCC in spatial data management
When you create spatial data in ArcGIS you generally have the option to create shapefiles or feature classes. Feature classes are the infrastructure ESRI use to store point, line, polygon or annotation features. Feature classes are stored in ESRI "Geodatabases" that have improved support for spatial data management, including organisation and topological management (basic rules that define how your data is managed for quality assurance).The Geodatabase "Feature Dataset" may be used to store feature classes of similar spatial extent or type, and automatically have their projection defined when they are created. This reduces the downtime associated with future feature class creation. In simple, all new spatial features will use the same projection, and as an added bonus may also be edited concurrently with other layers in the same feature dataset.
Shared benefits
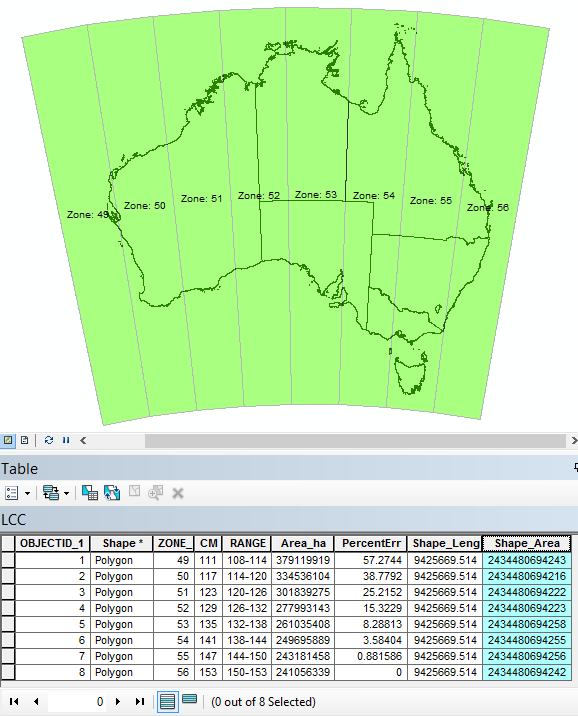
By far the biggest benefit of this system of spatial data management is the elimination of zone based data management issues. Manual area calculations are replaced by automated area and length calculations for line and polygon features. By default, ArcGIS creates two fields in line and polygon feature classes that dynamically calculate changes in coordinate geometry based on the data layer units (e.g. metres). This eliminates the need for user interaction, especially where data is served at enterprise level.The image below displays the resultant dynamic field calculations when data is managed using the Lamberts projection system. The minor differences present in the attribute table "Shape_" columns are insignificant at this scale. In contrast the "PercentErr" field relates to the "Area_ha" calculation field showing a departure from the calculated coordinate geometry value in Row 8. The "Area_ha" field was calculated manually using an ArcMap dataframe projected in MGA Zone 56.
The self managed solution
The benefits are many, especially where symbology is defined for spatial layers based on either of these fields. Data that is used by editors is dynamically updated for accurate area or length based reporting. Data consumed by readers using ArcGIS desktop or web services from ArcGIS server can rest assured knowing the coordinate geometry is always current. This type of assurance is critical for organisations that have both public and private responsibilities to deliver on time and to the highest standard possible.Have a question about something in this article? You can receive help directly from the article author. Sign up for a free trial to get started.
Comments (1)
Commented: