VMware Live Performance Troubleshooting

Published:
Browse All Articles > VMware Live Performance Troubleshooting
We've all been there - users are complaning about application performance and looking for you to provide a magic solution to 'make it like it was'. With today's increasingly complex virtualized environments, performance troubleshooting is more difficult and nuanced than ever. Aside from spending thousands of dollars on tools that may help to identify performance bottlenecks, what can we do once we've been informed of a potential issue?
In a VMworld environment the primary tool for real time troubleshooting is going to be esxtop. This utility performs the same basic function that Taskmanager performs in a Windows environment. Running esxtop is as simple as enabling ssh access to a host, connecting, logging in and running it from the command prompt. I always recommend running it via ssh (putty does a good job displaying the data) as you have more flexibility when it comes to sizing the window. For those who like to stay as far away from the command line as possible you can use Visual Esxtop. This will give you all of the same counters with the added value of tool tips which define the counters!
![help.png]()
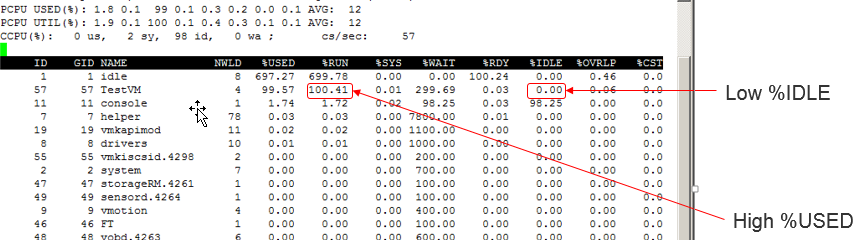
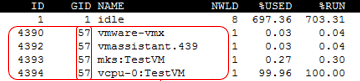
By default the CPU view will show all running processes on the host - upper case V will switch to just virtual machines (VMs). It is important to note that for a given VM there are multiple processes that run it. The group of processes make up the 'World' the VM runs in. The default view shows an aggregate of these. You can expland/collapse a particular VM by pressing e followed by the ID.
![cpu.png]() Pro Tip: if PCPU Used differs from PCUP Util by more than a factor of two you are most likely running into http://kb.vmware.com/kb/10
Pro Tip: if PCPU Used differs from PCUP Util by more than a factor of two you are most likely running into http://kb.vmware.com/kb/1018206
![mem.png]()
![net.png]()
![disk.png]()
![device.png]()
![vmdisk.png]() It is possible to change the statistics field you see on each of these screens. To do so press the f key and toggle the fields on/off as you would like.
It is possible to change the statistics field you see on each of these screens. To do so press the f key and toggle the fields on/off as you would like.
Seeing 100% cpu inside of a virtual machine can have more than one root cause. We will cover several common root causes.
Starved VM
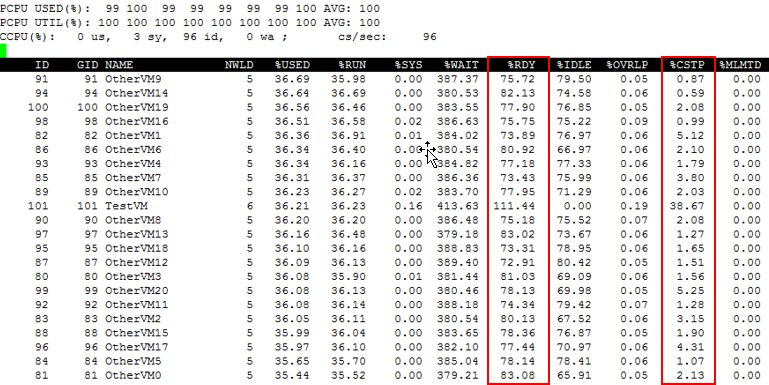
We can check the history graph in vCenter server to look for any trends. We may see a VM that, over time, has slowly increased in utilization and as such could benefit from additional CPUs. We can validate this in esxtop by examining %RUN and % IDLE. A VM with very low idle and high run is CPU starved.
![starvedvm.png]() Expanding the world shows us that the vCPU is responsible for the high use.
Expanding the world shows us that the vCPU is responsible for the high use.
![vcpurun.png]() Solution: This VM would benefit from another CPU.
Solution: This VM would benefit from another CPU.
One word of caution - only add CPUs when there is a proven need. Performance issues are sometimes caused by too many CPUs being provisioned on a host!
Bloated VM
The danger of too many CPUs being provisioned is that you can force the CPU scheduler to queue workloads or run them slightly out of sync (%CSTP). For simplicity here I'm ignoring hypertheading; however the example stands.
Each physical CPU in your host has the ability to run one virtual CPU's worth of instruction. This is called a Hardware Execution Context (HEC). Think of a HEC like a bank teller. If both a small business owner and someone performing personal banking (VMs) enter the bank (CPU) one after the other with four tellers (cores) and the small business owner requests all four tellers to complete his transaction, then the person needing only one teller to perform their personal banking transaction has to wait until one teller frees up.
In the opposite case where the personal banking is using one of four tellers the small business owner is able to start his transaction on the remaining three but will have to wait until the fourth becomes available to complete the transaction. Bloated VMs are more likely to cause wait states (CSTP) on other VMs. A VM with high %IDLE may be a good candidate for shrinking. Just like the principal of least privilege in security we should build VMs using the principal of Least Resources in a virtual world.
Solution: Remove vCPUs from bloated VMs.
Pro-Tip:For more information on CPU scheduling review the following doc: The CPU Scheduler in vSphere
Overcommitted Host
It is possible to simply place more workload on a host than it has CPU capacity for. Ideally, Dynamic Resoure Scheduling should mitigate this risk but there may be some instances where this occurs. You will see high %RDY (% of time the world is ready to run but has no HEC) and potentially high CSTP in a situation like this.
![over.png]() Solution: Move VMs to another host or power off unneeded workloads.
Solution: Move VMs to another host or power off unneeded workloads.
Memory
ESXi uses several techniques to utilize memory most efficiently. As host memory pressure climbs more aggressive memory management is used. Transparent Page Sharing, Ballooning, Compression and Swapping are all covered in detail in this excellent white paper.
Starved VM - Memory
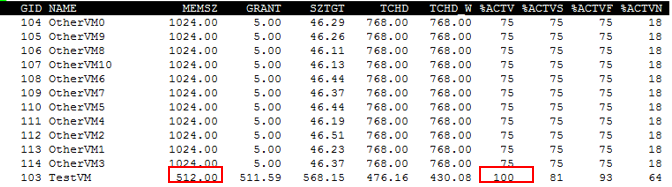
A VM which could use additional memory will show that it is currently using all assigned and has a high %ACTV (activly using) memory. If not suffering from a memory leak or some other guest OS related issues this VM would perform better with additional RAM allocated to it.
![memorystarved.png]() Solution - Add Memory
Solution - Add Memory
Network
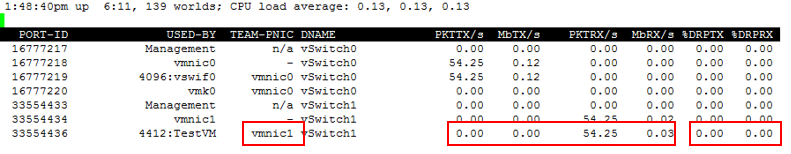
We can examine dropped packets live in the network view. Best practice requires that your host have more than one physical NIC. VMware calls these vmnic0, vmnic1 and so on. These are the physical NICs in your host. We can examine utilization and dropped packets from the network view.
![networkfields.png]() Most commonly we'll see driver/firmware that is out of date, a configuration issue or dropped packets inside of the guest but not at the host level.
Most commonly we'll see driver/firmware that is out of date, a configuration issue or dropped packets inside of the guest but not at the host level.
Storage
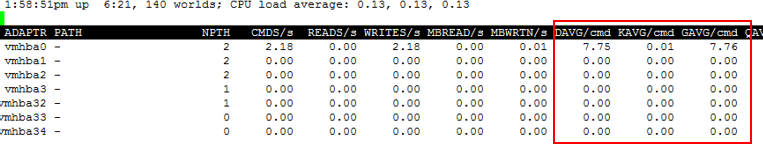
The most interesting counters for storage are DAVG, KAVG and GAVG all measured in ms. KAVG is the latency per command due to the VMware kernel. We expect this to be a fraction of DAVG most times. DAVG is round trip latency between the HBA on the host to the array and back. DAVG should be at or below 10ms for most sever workloads with spikes up to 40 acceptable. For consistent utilization over 50ms examine SAN and array health. GAVG is the latency seen at the guest. This is a summary of D and K.
![storage.png]() Solution - Examine SAN health for high DAVG.
Solution - Examine SAN health for high DAVG.
esxtop –a –b –n iterations –d delay between updates
Example to collect indefinitely to one file
Example to collect 1 hours worth data using a 5 second interval
Scoping
Scoping the issue is always the first step no matter physical or virtual environment. Have the reporter describe the issue in detail: what are you doing, how long did it used to take, how often do you do it, who all does it and how long should it take. A user who reports "It's slow" doesn't give you nearly enough data to begin solving the issue. Have them get specific.In a VMworld environment the primary tool for real time troubleshooting is going to be esxtop. This utility performs the same basic function that Taskmanager performs in a Windows environment. Running esxtop is as simple as enabling ssh access to a host, connecting, logging in and running it from the command prompt. I always recommend running it via ssh (putty does a good job displaying the data) as you have more flexibility when it comes to sizing the window. For those who like to stay as far away from the command line as possible you can use Visual Esxtop. This will give you all of the same counters with the added value of tool tips which define the counters!
Familiarizing ourselves with esxtop
Upon launch you are greeted with the CPU usage view. At any point you can press h for the help screen. Esxtop covers each of the four primary server sub-systems: CPU, Memory, Disk and Network.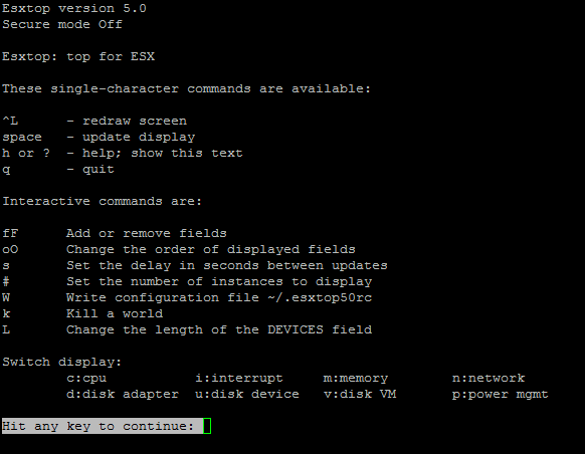
CPU
By default the CPU view will show all running processes on the host - upper case V will switch to just virtual machines (VMs). It is important to note that for a given VM there are multiple processes that run it. The group of processes make up the 'World' the VM runs in. The default view shows an aggregate of these. You can expland/collapse a particular VM by pressing e followed by the ID.
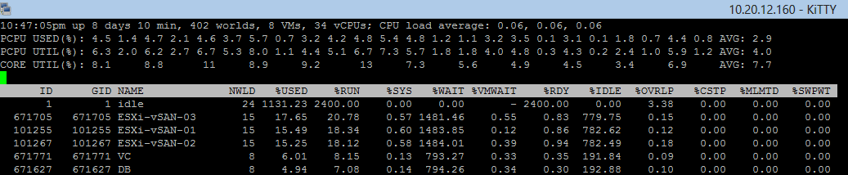 Pro Tip: if PCPU Used differs from PCUP Util by more than a factor of two you are most likely running into http://kb.vmware.com/kb/10
Memory
Select m and you will be taken to the memory view. This view gives you a summary for the host and statistics for each virtual machine.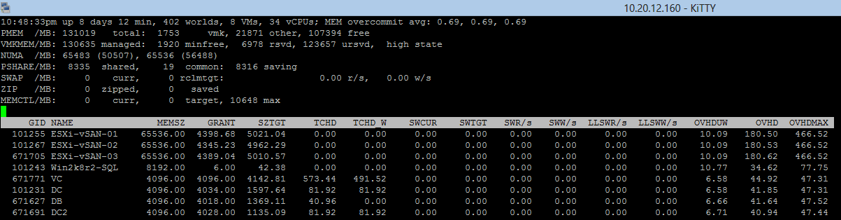
Network
In the Network view (n) you can see which VM is connected to which port-id, Physical NIC and vSwitch. In addition you can observe packet drops and Mb TX/RX per second.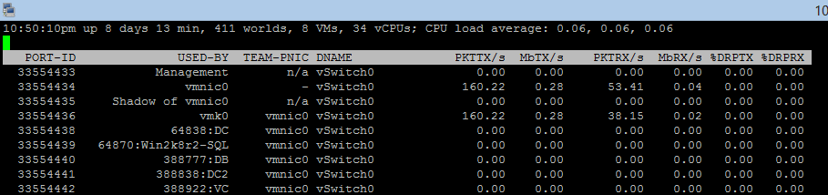
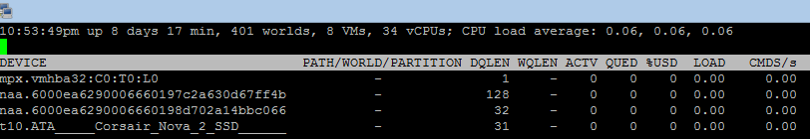
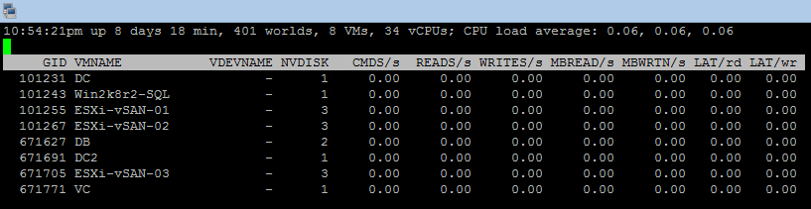
Disk
There are three disk views: Disk adapter (d), Desk Device (u) and Disk View (v). Disk adapter shows per host status for the physical Host Bus Adapters (vmhba0, vmhba1...) including total commands (IOPS) and read/write latencies. Disk device view shows Q lengths, IOPS and latencies for the indivicual LUNs attached to the host. VM Disk view shows per VM commands, reads/writes and latencies.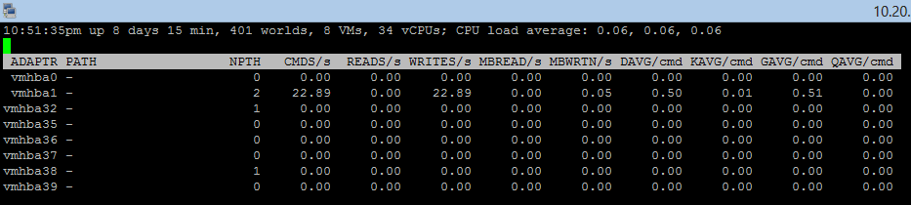
 It is possible to change the statistics field you see on each of these screens. To do so press the f key and toggle the fields on/off as you would like.
Common Performance Issues
CPUSeeing 100% cpu inside of a virtual machine can have more than one root cause. We will cover several common root causes.
Starved VM
We can check the history graph in vCenter server to look for any trends. We may see a VM that, over time, has slowly increased in utilization and as such could benefit from additional CPUs. We can validate this in esxtop by examining %RUN and % IDLE. A VM with very low idle and high run is CPU starved.
 Expanding the world shows us that the vCPU is responsible for the high use.
 Solution: This VM would benefit from another CPU.
One word of caution - only add CPUs when there is a proven need. Performance issues are sometimes caused by too many CPUs being provisioned on a host!
Bloated VM
The danger of too many CPUs being provisioned is that you can force the CPU scheduler to queue workloads or run them slightly out of sync (%CSTP). For simplicity here I'm ignoring hypertheading; however the example stands.
Each physical CPU in your host has the ability to run one virtual CPU's worth of instruction. This is called a Hardware Execution Context (HEC). Think of a HEC like a bank teller. If both a small business owner and someone performing personal banking (VMs) enter the bank (CPU) one after the other with four tellers (cores) and the small business owner requests all four tellers to complete his transaction, then the person needing only one teller to perform their personal banking transaction has to wait until one teller frees up.
In the opposite case where the personal banking is using one of four tellers the small business owner is able to start his transaction on the remaining three but will have to wait until the fourth becomes available to complete the transaction. Bloated VMs are more likely to cause wait states (CSTP) on other VMs. A VM with high %IDLE may be a good candidate for shrinking. Just like the principal of least privilege in security we should build VMs using the principal of Least Resources in a virtual world.
Solution: Remove vCPUs from bloated VMs.
Pro-Tip:For more information on CPU scheduling review the following doc: The CPU Scheduler in vSphere
Overcommitted Host
It is possible to simply place more workload on a host than it has CPU capacity for. Ideally, Dynamic Resoure Scheduling should mitigate this risk but there may be some instances where this occurs. You will see high %RDY (% of time the world is ready to run but has no HEC) and potentially high CSTP in a situation like this.
 Solution: Move VMs to another host or power off unneeded workloads.
Memory
ESXi uses several techniques to utilize memory most efficiently. As host memory pressure climbs more aggressive memory management is used. Transparent Page Sharing, Ballooning, Compression and Swapping are all covered in detail in this excellent white paper.
Starved VM - Memory
A VM which could use additional memory will show that it is currently using all assigned and has a high %ACTV (activly using) memory. If not suffering from a memory leak or some other guest OS related issues this VM would perform better with additional RAM allocated to it.
 Solution - Add Memory
Network
We can examine dropped packets live in the network view. Best practice requires that your host have more than one physical NIC. VMware calls these vmnic0, vmnic1 and so on. These are the physical NICs in your host. We can examine utilization and dropped packets from the network view.
 Most commonly we'll see driver/firmware that is out of date, a configuration issue or dropped packets inside of the guest but not at the host level.
Storage
The most interesting counters for storage are DAVG, KAVG and GAVG all measured in ms. KAVG is the latency per command due to the VMware kernel. We expect this to be a fraction of DAVG most times. DAVG is round trip latency between the HBA on the host to the array and back. DAVG should be at or below 10ms for most sever workloads with spikes up to 40 acceptable. For consistent utilization over 50ms examine SAN and array health. GAVG is the latency seen at the guest. This is a summary of D and K.
 Solution - Examine SAN health for high DAVG.
Last items
It is possible to run esxtop in batch mode and gather data over several hours or longer. This process creates a CSV which can be opened using perfmon. The basics are:esxtop –a –b –n iterations –d delay between updates
Example to collect indefinitely to one file
- esxtop –a –b > /some_directory/some_file.
csv
Example to collect 1 hours worth data using a 5 second interval
- esxtop –a –b –n 720 –d 5 > /some_directory/some_file.
csv
Have a question about something in this article? You can receive help directly from the article author. Sign up for a free trial to get started.
Comments (2)
Author
Commented:Thanks,
Calvin Paxson
Author
Commented: