

Browse All Articles > An Introduction to R Programming and R Studio
Having just graduated from college and entered the workforce, I don’t find myself always using the tools and programs I grew accustomed to over the past four years. However, there is one program I continually find myself reverting back to…R.
So what is R? R is a programming language and environment with an ever-growing bucket of tools for statistical processing and graphic creation. According to the R-project website, R includes
Sure, graduating with a minor in Statistics and my love for data manipulation may make me partially biased with using R but I feel like its uses are incredibly wide-reaching. The great thing about R is it allows the user to perform simple arithmetic calculations with matrices or dive in deeper and create complex graphs or even create dynamic reports to incorporate LaTeX.
Another incredible feature is you have an overwhelming amount of “packages” at your disposal to increase the functionality of your code. R Studio (a program I will explain in a few paragraphs) allows you to download and install these automatically with the options to toggle them on and off.
My plan is to write a series of articles here that will cover a multitude of important functions and topics using R. I think it is an incredibly underutilized tool that can be very adaptable to a wide array of people and topic areas. The articles will start off with the basics (downloading and utilizing R), and progressively get into more advanced concepts, and eventually covering some functionality with R Sweave and LaTeX incorporation with R that I found incredibly useful in college.
So, to start you will need to download R, which can be done here. Do this first before proceeding. Next, you have the option of installing R Studio, a UI tool that helps make functionality with R a lot more user friendly. R Studio can be downloaded here. My articles will include R code but will be executed using R Studio.
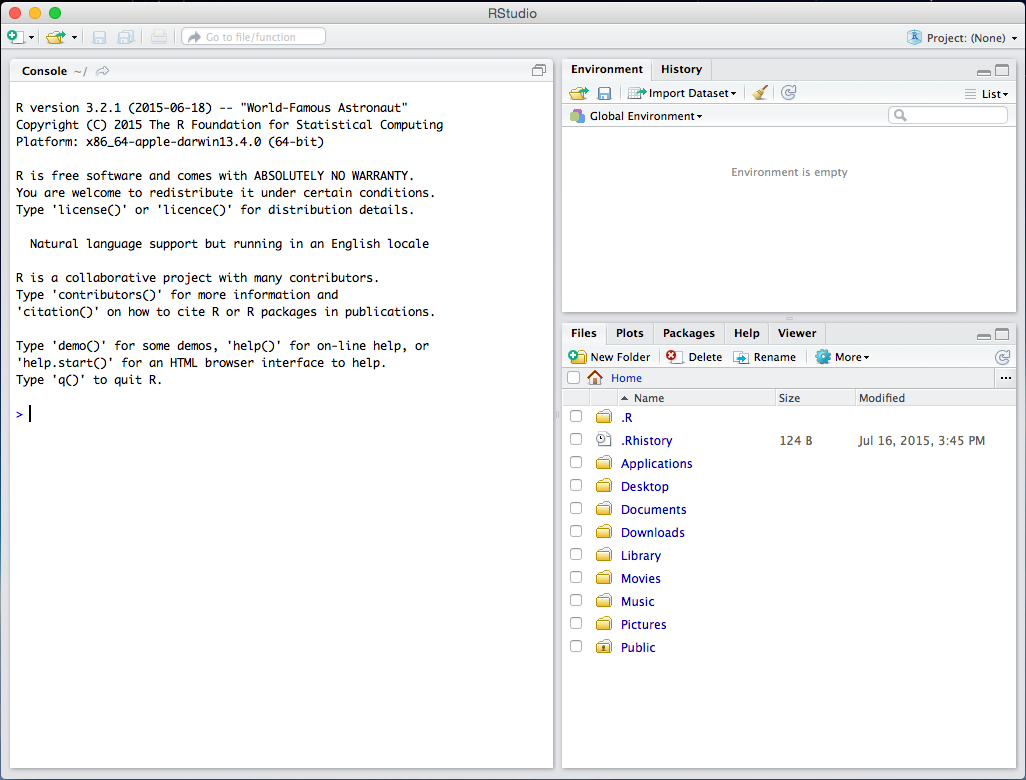
What you will see at first is an environment with three columns (see image below). The left column is your console window. This is where all of the code you want to execute should go and where the output will be displayed. The possibilities of what you will see in this window are endless so we will address more things as we move on. The right top window is the location where you will see all the variables and items stored in the workspace you will see. Below that you will notice a window with a few different tabs (Files, Plots, Packages, etc.). This is where you can see items in your working directory, view plots, download and choose packages, and quite a few more options.
![Screen-Shot-2015-07-20-at-8.16.15-AM.png]()
My first recommendation, along with getting familiar and checking out the functionality and preferences yourself, is to set your working directory first! Your working directory will be the location where the variables in the environment are saved. If you call any “save functions”, unless you specify another location in the variables, they will save to your working directory. To do so, on the navigation bar at the top select Session >> Set Working Directory >> Choose Directory...
![Screen-Shot-2015-07-20-at-8.56.44-AM.png]()
As you can see in the console window, the function setwd(" ") is run, this is another way of completing the same functionality with simple R code. Another cool functionality is all the files in your working directory will easily be displayed and accessible via the bottom right window. The current working directory location can be viewed next to the “Console” window title on the left of the environment. I find this to be a very easy change that a lot of people overlook and can eliminate confusion later.
Now that you have changed your working directory and have gotten familiar with the basic layout of R Studio, it is time to write your first lines of code! My recommendation when writing code is to write it all in a script file so it can be saved or changed at a later time. To do so, click the “new” button on the top left and select “R Script” (see image below). As you can see this brings up a new window on the top left of the interface where code can be written. I recommend you play and adjust the windows on the interface to what fits your personal preference.
![Screen-Shot-2015-07-20-at-8.18.48-AM--3-]()
Try writing your first snippet of code:
If you want to save any script, click the save disk on the top of the top left window and save it wherever you would like! The default folder that will show up will be your current working directory!
That should give you a basic understanding to start discovering on your own what functionalities R is capable of. Right now it may look you that it is simply a bigger version of your desk calculator but I promise it is so much more. In future articles I will show and explain the incredible functionality of R as it applies to statistical data manipulation to get the most out of your information. If you have any questions about my article or have suggestions for future topics please leave a comment!
Next article in the series: https://www.experts-exchange.com/articles/19199/Mastering-R-Programming-Using-Packages-Creating-Objects-and-Basic-Matrix-Functions.html
So what is R? R is a programming language and environment with an ever-growing bucket of tools for statistical processing and graphic creation. According to the R-project website, R includes
- an effective data handling and storage facility,
- a suite of operators for calculations on arrays, in particular matrices,
- a large, coherent, integrated collection of intermediate tools for data analysis,
- graphical facilities for data analysis and display either on-screen or on hardcopy, and
- a well-developed, simple and effective programming language which includes conditionals, loops, user-defined recursive functions and input and output facilities.
Sure, graduating with a minor in Statistics and my love for data manipulation may make me partially biased with using R but I feel like its uses are incredibly wide-reaching. The great thing about R is it allows the user to perform simple arithmetic calculations with matrices or dive in deeper and create complex graphs or even create dynamic reports to incorporate LaTeX.
Another incredible feature is you have an overwhelming amount of “packages” at your disposal to increase the functionality of your code. R Studio (a program I will explain in a few paragraphs) allows you to download and install these automatically with the options to toggle them on and off.
My plan is to write a series of articles here that will cover a multitude of important functions and topics using R. I think it is an incredibly underutilized tool that can be very adaptable to a wide array of people and topic areas. The articles will start off with the basics (downloading and utilizing R), and progressively get into more advanced concepts, and eventually covering some functionality with R Sweave and LaTeX incorporation with R that I found incredibly useful in college.
So, to start you will need to download R, which can be done here. Do this first before proceeding. Next, you have the option of installing R Studio, a UI tool that helps make functionality with R a lot more user friendly. R Studio can be downloaded here. My articles will include R code but will be executed using R Studio.
What you will see at first is an environment with three columns (see image below). The left column is your console window. This is where all of the code you want to execute should go and where the output will be displayed. The possibilities of what you will see in this window are endless so we will address more things as we move on. The right top window is the location where you will see all the variables and items stored in the workspace you will see. Below that you will notice a window with a few different tabs (Files, Plots, Packages, etc.). This is where you can see items in your working directory, view plots, download and choose packages, and quite a few more options.
My first recommendation, along with getting familiar and checking out the functionality and preferences yourself, is to set your working directory first! Your working directory will be the location where the variables in the environment are saved. If you call any “save functions”, unless you specify another location in the variables, they will save to your working directory. To do so, on the navigation bar at the top select Session >> Set Working Directory >> Choose Directory...
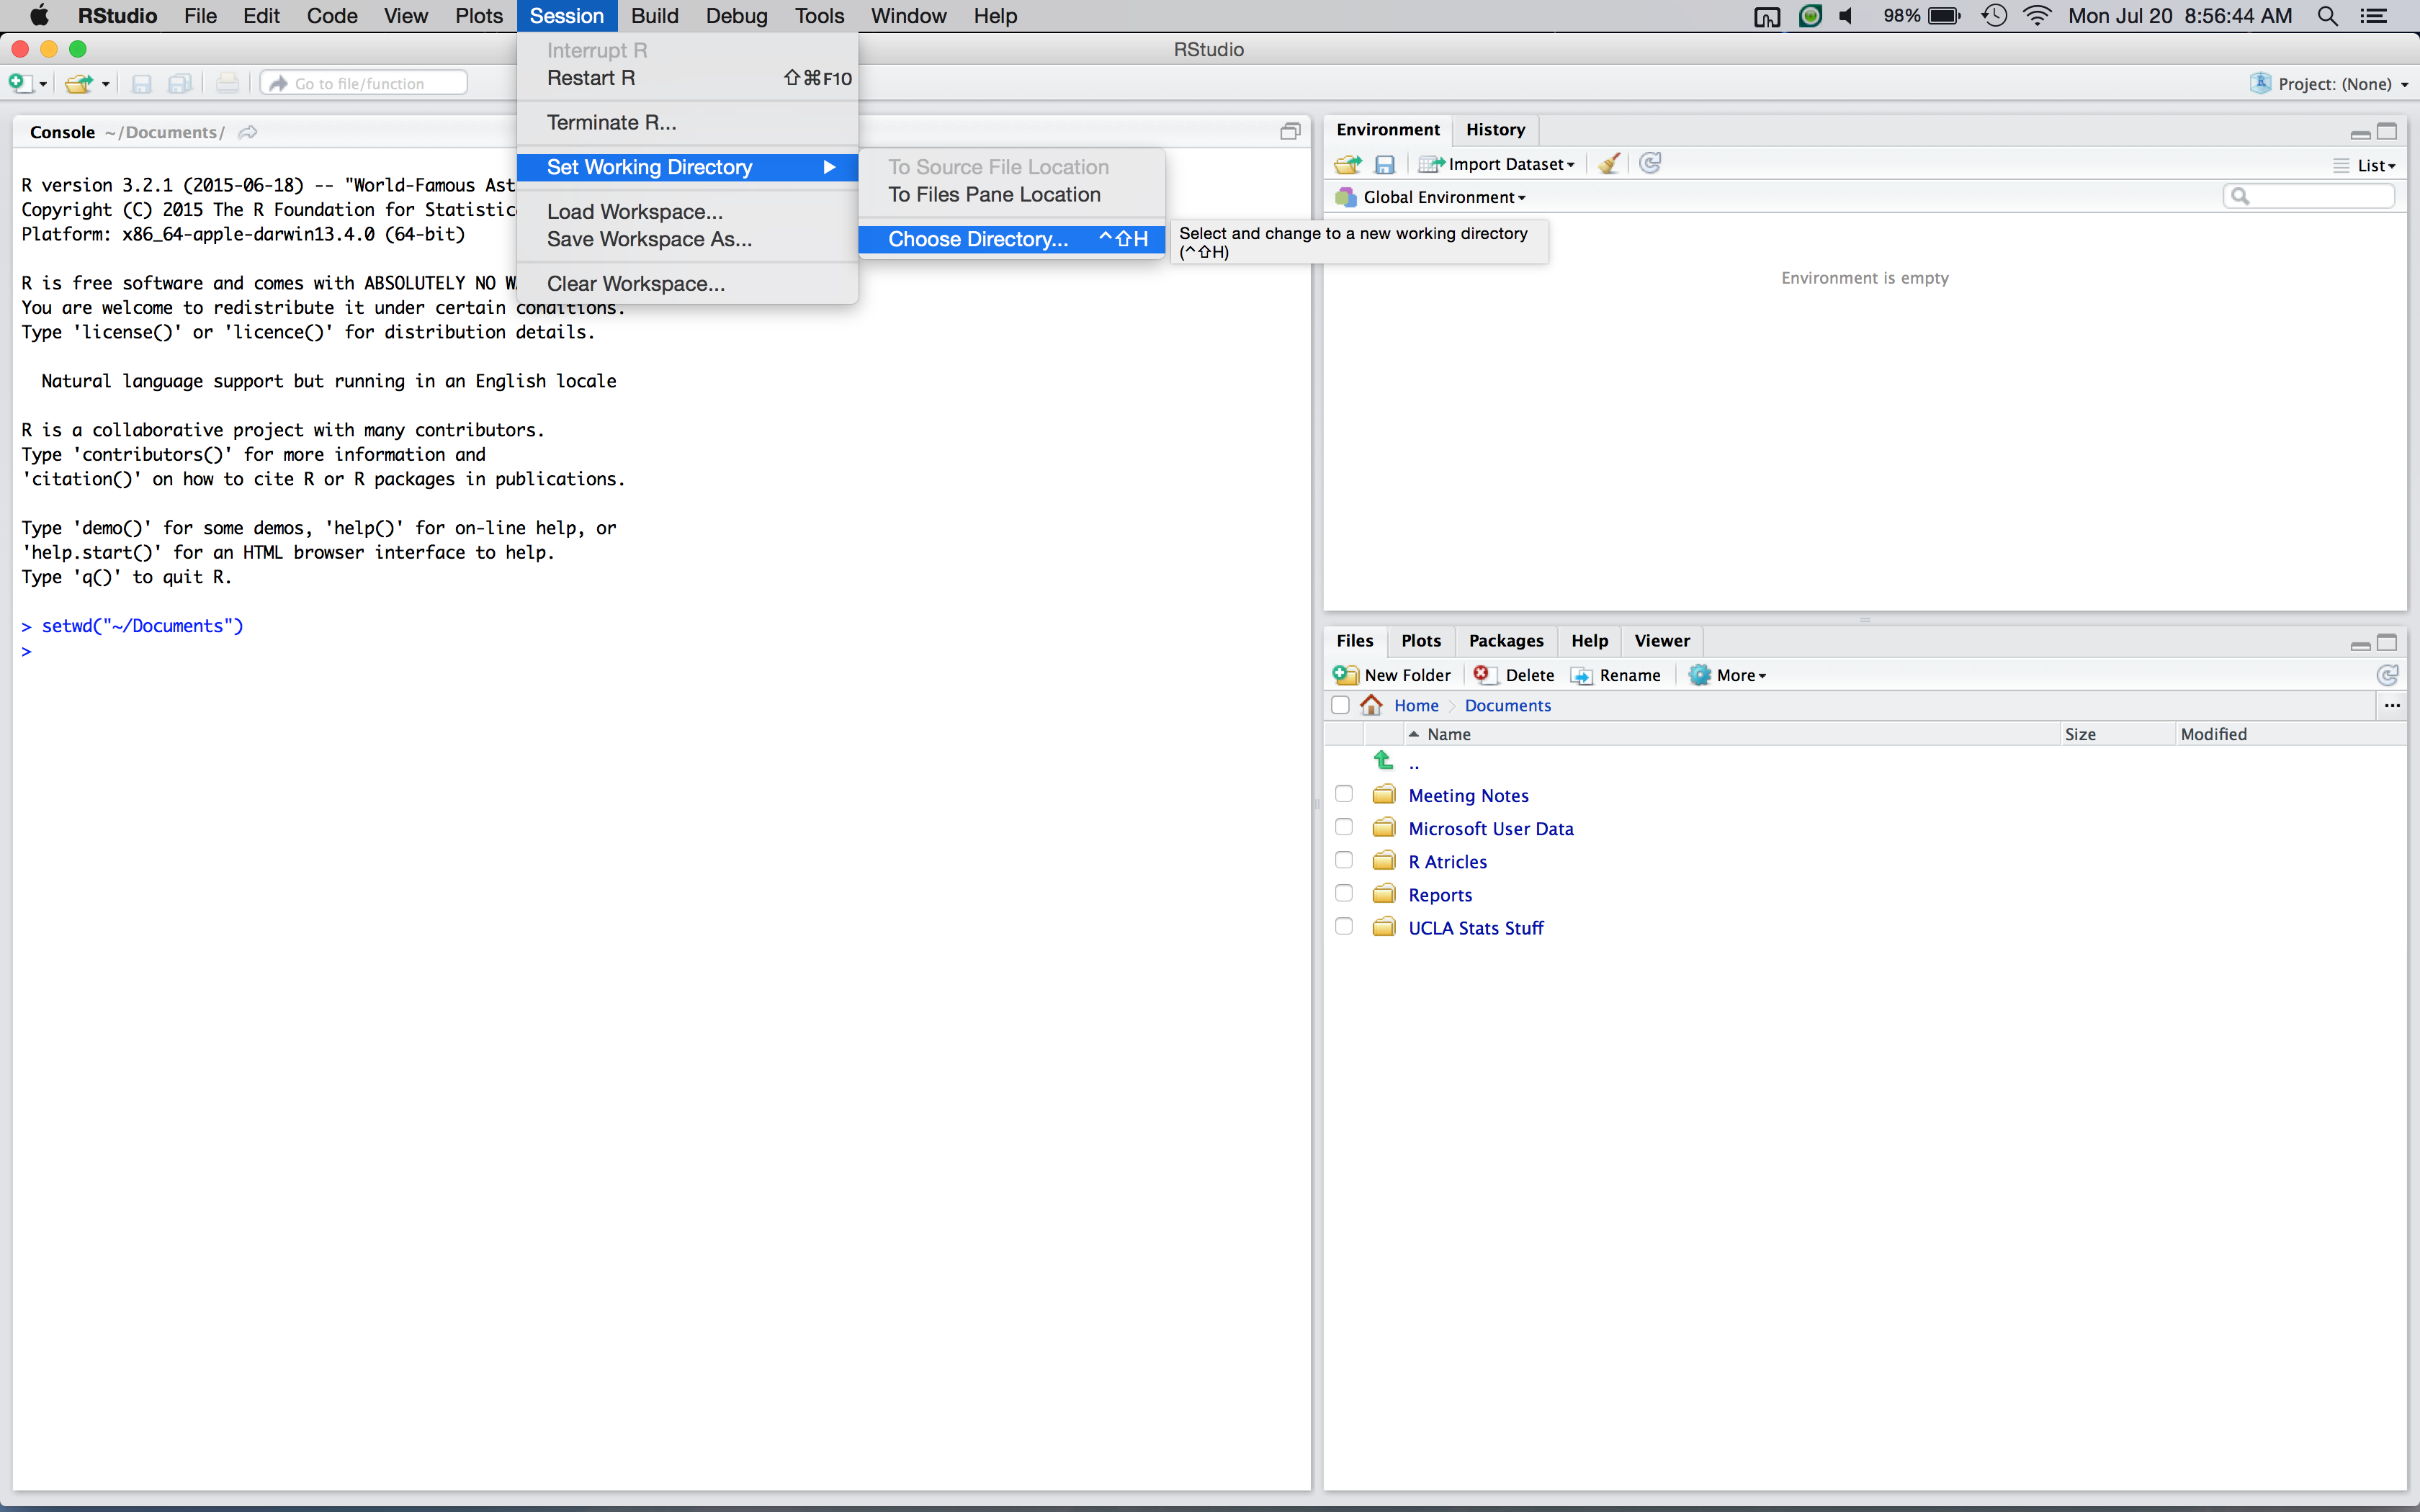
As you can see in the console window, the function setwd(" ") is run, this is another way of completing the same functionality with simple R code. Another cool functionality is all the files in your working directory will easily be displayed and accessible via the bottom right window. The current working directory location can be viewed next to the “Console” window title on the left of the environment. I find this to be a very easy change that a lot of people overlook and can eliminate confusion later.
Now that you have changed your working directory and have gotten familiar with the basic layout of R Studio, it is time to write your first lines of code! My recommendation when writing code is to write it all in a script file so it can be saved or changed at a later time. To do so, click the “new” button on the top left and select “R Script” (see image below). As you can see this brings up a new window on the top left of the interface where code can be written. I recommend you play and adjust the windows on the interface to what fits your personal preference.
Try writing your first snippet of code:
print("Hello World")> print("Hello World")
[1] "Hello World"2+2
(1/2)*(1/4)
(2*3)/4If you want to save any script, click the save disk on the top of the top left window and save it wherever you would like! The default folder that will show up will be your current working directory!
That should give you a basic understanding to start discovering on your own what functionalities R is capable of. Right now it may look you that it is simply a bigger version of your desk calculator but I promise it is so much more. In future articles I will show and explain the incredible functionality of R as it applies to statistical data manipulation to get the most out of your information. If you have any questions about my article or have suggestions for future topics please leave a comment!
Next article in the series: https://www.experts-exchange.com/articles/19199/Mastering-R-Programming-Using-Packages-Creating-Objects-and-Basic-Matrix-Functions.html
Have a question about something in this article? You can receive help directly from the article author. Sign up for a free trial to get started.
Comments (3)
Commented:
Commented:
Very well written introduction article, voting Yes.
I'm currently in Seattle attending PASS Summit 2015, and in the keynote they're doing a big demo of SQL Server 2016 features, which include built-in R language and real-time data analytics on data flowing from OLTP systems. So if anything there may be opportunity for you to write a sequel (no pun intended) article on R programming in SQL Server 2016.
Thanks.
Jim
Commented:
Microsoft bought Revolution Analytics : http://blogs.technet.com/b/machinelearning/archive/2015/04/06/microsoft-closes-acquisition-of-revolution-analytics.aspx specifically for incorporating analytics on big data. But also means that having incorporated R and the RODBC drivers as well.
Here is an interesting look at how SQL and R can co-exist quite happily via RODBC (an article written about the same time as acquisition was finalised) : https://www.simple-talk.com/sql/reporting-services/making-data-analytics-simpler-sql-server-and-r/
So, maybe something along those lines ? I am sure Jim or Me (plus others) can assist.