

Browse All Articles > Simple Linear Regression in MS Access
by Patrick G. Matthews
Linear regression analysis is a common statistical technique used to infer the possible relationships between a dependent variable and one or more independent variables. While Microsoft Access does not have any native functions that specifically address regression analysis, it is possible to perform regression analysis in Access via queries.
This article provides a basic introduction to linear regression analysis, as well as instructions on how to perform a so-called "simple" linear regression (i.e., the model uses a single independent variable to estimate the dependent variable) in Access, using first a purely native Jet SQL approach, and then using a Visual Basic for Applications (VBA) user defined function to simplify the query definition. (This article addresses neither multiple linear regression--i.e., regression analysis using more than one independent variable--nor any regression method producing anything other than a linear relationship between the independent variable and the dependent variable.)
This article also provides the source code for this new DSimpleRegress function, as well as sample files demonstrating the techniques described here. Finally, this article discusses limitations to the approach described here, as well as other products that may be useful for regression analysis.
Note: It is not the intent of this section to provide in-depth information on regression analysis. Entire books and university courses are devoted to the subject, and even introductory level statistics courses may spend several weeks on the subject. This section is intended to introduce the rudiments of regression analysis, and nothing more.
Regression analysis is a statistical technique used to quantify the apparent relationships between one or more independent variables and a dependent variable. That is, regression analysis provides a model for understanding how isolated changes in the independent variables affect the dependent variable's value.
In the simplest case, there is one independent variable (X), one dependent variable (Y), and an assumption that there is a linear relationship between the two. For example, consider the small data set below:
![Observed Data]()
A quick visual inspection suggests that the two variables are related; as X increases, Y tends to increase as well, although the relationship is not perfect. One could try to approximate this relationship by drawing a line over the data plot:
![Observed Data with Line]()
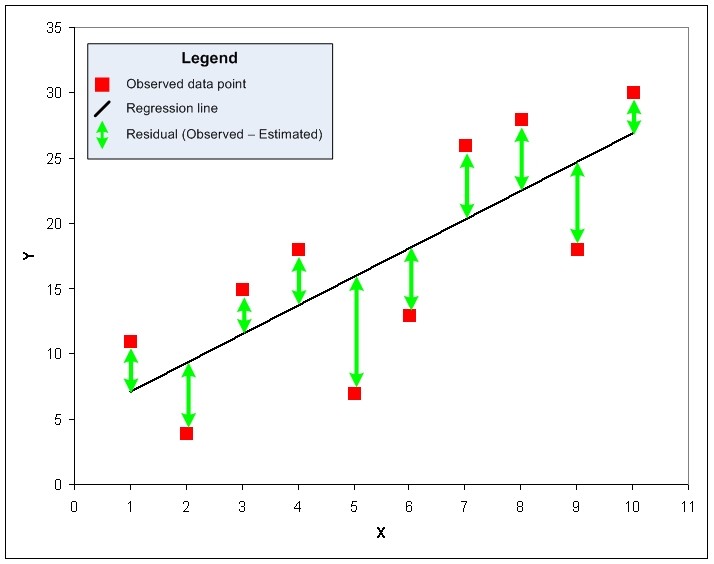
That line does a fair job for this data set. The goal for regression analysis is to find the equation that produces the best such line, with "best" defined as being that line such that the sum of the squares of the residuals--the difference between the actual value of the dependent value and the value estimated by the regression model--is minimized, as seen below:
![Observed Data with Line and Residuals]()
To describe this linear relationship, and to enable estimates for the dependent variable based on any given value of the dependent variable, regression analysis allows us to define the model in terms of the simple slope-intercept form of a linear equation:
![Line Equations]()
In that form, "m" is the slope of the line (the change in Y per unit change in X), and "b" is the "intercept" term, or the value for Y when X = 0. By convention, in regression analysis, the slope of the line is often referred to as the "regression coefficient" and represented by the lower case Greek letter beta (ß) with s subscript of 1, and the intercept term is often represented by the lower case Greek letter beta (ß) with s subscript of 0.
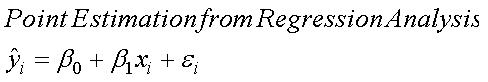
This equation then determines the estimated "Y" ("Y hat") for any given value of "X":
![Point Estimation]()
In that equation, the regression coefficient (or slope, m) and the intercept (b) are givens; substituting the given value for X then determines the estimated value for Y. The epsilon represents the residual, or error term: the estimated value may differ from an actual, observed value for Y at that given value of X.
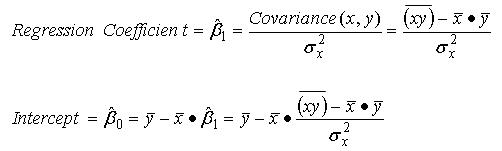
In a simple linear regression model, with just a single independent variable, the following equations describe how to calculate the regression coefficient and intercept for a given set of data:
![Regression Coefficint Formulas]()
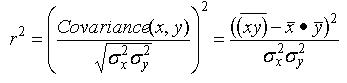
In addition to those values, in regression analysis it is typical to calculate additional statistics that describe the quality of the regression model. The first of these is the coefficient of determination, usually labeled "r squared". The coefficient of determination is the proportion of the variance in the observed values of the dependent variable that is explained by the regression model. Thus, for example, if the coefficient of determination is 0.75, then approximately 75% of the variance in Y is explained by the regression model. The following formula calculates the coefficient of determination for a simple linear model:
![Coefficient of Determination (r-squared)]()
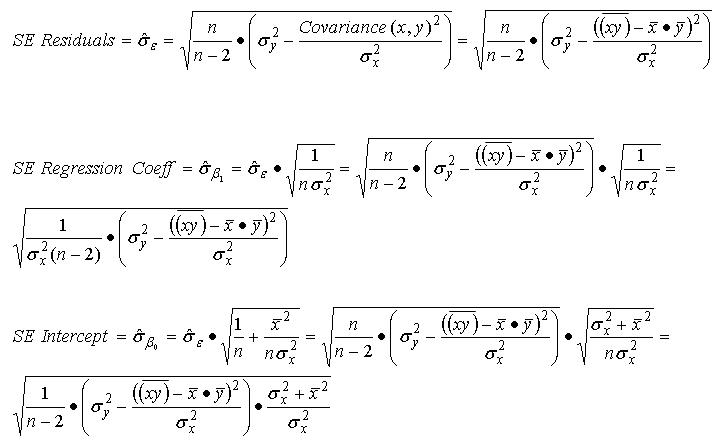
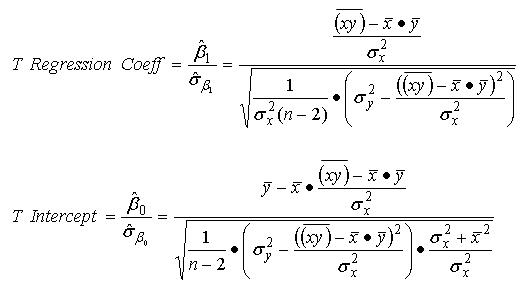
Statisticians will also typically compute the standard error for the regression model itself (often referred to as the standard error of the residuals), as well as standard error values for the regression coefficient ("ß sub 1) and the intercept term ("ß sub zero"):
![Regression Standard Error Formulas]()
With these standard error values calculated, one may now test the regression coefficient and the intercept term for statistical significance--that is, determine the likelihood that the regression coefficient and intercept values arose by chance, and thus have no efficacy for use in estimating the dependent variable. This is usually done by computing the value of the t statistic, which in this case is simply the quotient of the regression coefficient or intercept value and the applicable standard error for that value:
![Regression t Statistic Formulas]()
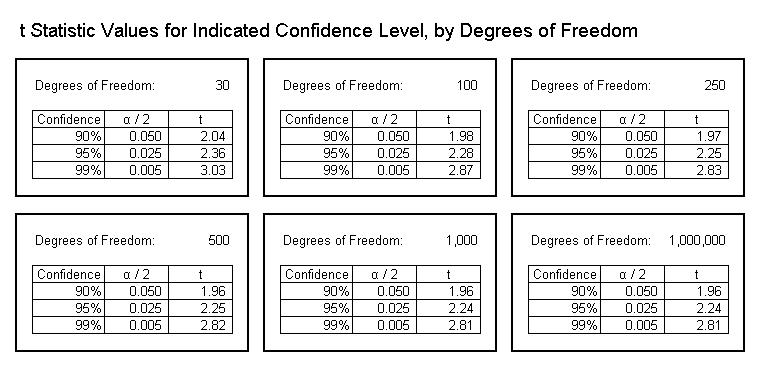
The t statistic value indicates the degree of confidence in the result--that is, the probability that the result is not an artifact of chance. The confidence level is determined by the value of the t statistic and the number of degrees of freedom for the regression model. (In linear regression, the degrees of freedom are always the number of observed data points, minus the number of idependent variables, minus one.) The table below illustrates the t statistic values associated with commonly-used confidence levels, by degrees of freedom:
![t Statistic Values by Confidence Level]()
It is possible to compute all of the various regression statistics described above using solely native Jet SQL, the SQL dialect for Access's Jet database engine. However, just as the formulas used to calculate these values can be quite complex, the SQL statements required for these calculation are not for the faint of heart.
In the attached Access database, I provide three sample data sets, and for each data set I calculate the regression coefficient, the intercept, and the r-squared value, with these statistics provided for:
In the simplest case, that for a complete data set, the SQL statement is as follows for "Set1":
To calculate regression statistics for subsets of the data, simply take the staement above, and add the columns that define the subsets to the SELECT and GROUP BY clauses:
For those examples, please note the following:
While all of these regression statistics can be calculated using only native Jet SQL, the formulas are quite complex. The resulting SQL statements would be long and, to most users, probably incomprehensible, and thus, to perform regression analysis in Access, I recommend using a VBA-powered approach as demonstrated below.
To facilitate simple linear regression analysis in Access, I have developed a new user defined function, DSimpleRegress. This function computes the various regression statistics described in the Basics of Linear Regression Analysis section of this article, and eliminates the need to employ complicated SQL statements.
For example, the following SQL statement calculates the full spread of regression statistics for the entire data set, in a much simpler fashion than by the "pure SQL" approach:
Further, the SQL statements required to capture the various subsets of data are also much simplified:
For those examples, please note the following:
DSimpleRegress is designed to behave similarly to the so-called "domain aggregate" functions in Access, such as DSum, DCount, DAvg, etc. It takes the following arguments:
Notes on names and qualifiers:
For the Stat argument, the following values are associated with the following statistics:
To implement DSimpleRegress in your Access project, simply copy the code below into a regular VBA module, and then use it in your queries, forms, reports, and/or other VBA procedures.
This article includes two sample files, an Access database and an Excel workbook.
Stats-Part-3.mdb
Stats-Article-Part-3.xls
Three significant limitations constrain the approach described here:
Thus, for example, while it is possible to use this approach to run a regression analysis on years of education (independent variable) and salary (dependent variable), it is not possible to run a regression analysis on years of education and years of experience (independent variables) and salary (dependent variable).
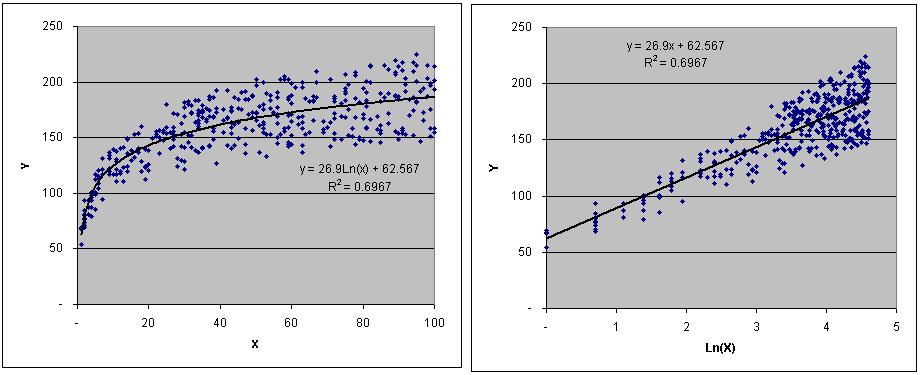
Further, this approach cannot be applied to analyze non-linear relationships. However, if the independent variable can be transformed to produce a linear relationship, then this approach can be used. For example, in Set3 in the sample Access database and Excel workbook, Y is related to the natural logarithm of X, as shown in the charts below:
![Logarithmic Regression]()
While this method is suitable for simple linear regression, if any of the limitations described above apply, then you may want to consider using another product:
Special thanks go out to EE Member and Page Editor harfang. When I originally posted this article, I used a correct but sub-optimal approach to calculating the regression statistics. With harfang's suggestions, I have been able to streamline the calculations, and significantly simplify the VBA code.
=-=-=-=-=-=-=-=-=-=-=-=-=-=-=-=-=-=-=-=-=-=-=-=-=-=-=-=-=-=-=-=-=-=-=-=-=-=-=-=-=
If you liked this article and want to see more from this author, please click here.
If you found this article helpful, please click the Yes button near the:
Was this article helpful?
label that is just below and to the right of this text. Thanks!
=-=-=-=-=-=-=-=-=-=-=-=-=-=-=-=-=-=-=-=-=-=-=-=-=-=-=-=-=-=-=-=-=-=-=-=-=-=-=-=-=
Introduction
Linear regression analysis is a common statistical technique used to infer the possible relationships between a dependent variable and one or more independent variables. While Microsoft Access does not have any native functions that specifically address regression analysis, it is possible to perform regression analysis in Access via queries.
This article provides a basic introduction to linear regression analysis, as well as instructions on how to perform a so-called "simple" linear regression (i.e., the model uses a single independent variable to estimate the dependent variable) in Access, using first a purely native Jet SQL approach, and then using a Visual Basic for Applications (VBA) user defined function to simplify the query definition. (This article addresses neither multiple linear regression--i.e., regression analysis using more than one independent variable--nor any regression method producing anything other than a linear relationship between the independent variable and the dependent variable.)
This article also provides the source code for this new DSimpleRegress function, as well as sample files demonstrating the techniques described here. Finally, this article discusses limitations to the approach described here, as well as other products that may be useful for regression analysis.
The Basics of Linear Regression Analysis
Note: It is not the intent of this section to provide in-depth information on regression analysis. Entire books and university courses are devoted to the subject, and even introductory level statistics courses may spend several weeks on the subject. This section is intended to introduce the rudiments of regression analysis, and nothing more.
Regression analysis is a statistical technique used to quantify the apparent relationships between one or more independent variables and a dependent variable. That is, regression analysis provides a model for understanding how isolated changes in the independent variables affect the dependent variable's value.
In the simplest case, there is one independent variable (X), one dependent variable (Y), and an assumption that there is a linear relationship between the two. For example, consider the small data set below:
 X     Y
                      --------
                       1    11
                       2     4
                       3    15
                       4    18
                       5     7
                       6    13
                       7    26
                       8    28
                       9    18
                      10    30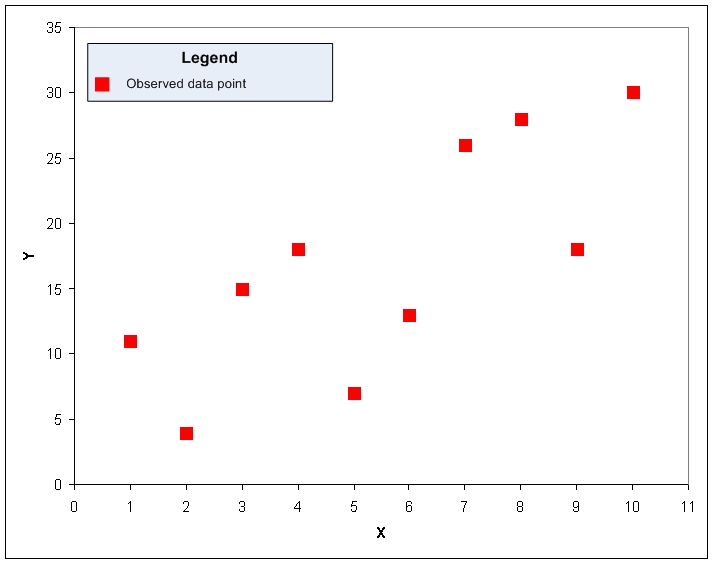
A quick visual inspection suggests that the two variables are related; as X increases, Y tends to increase as well, although the relationship is not perfect. One could try to approximate this relationship by drawing a line over the data plot:
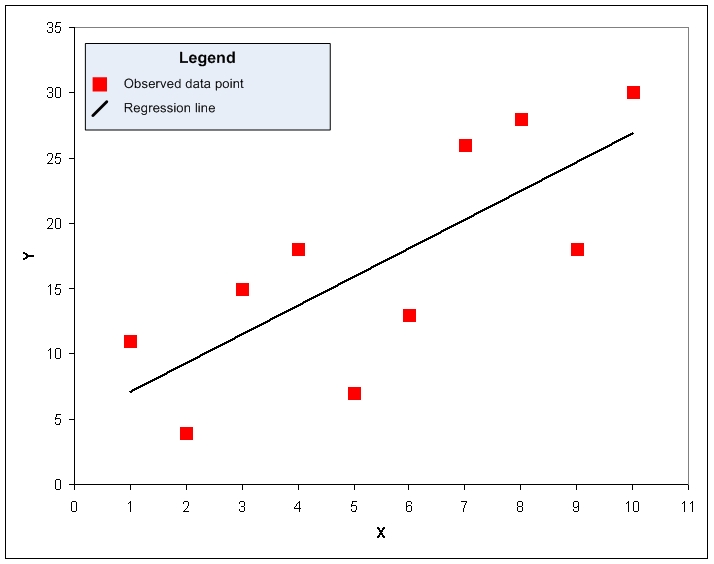
That line does a fair job for this data set. The goal for regression analysis is to find the equation that produces the best such line, with "best" defined as being that line such that the sum of the squares of the residuals--the difference between the actual value of the dependent value and the value estimated by the regression model--is minimized, as seen below:
To describe this linear relationship, and to enable estimates for the dependent variable based on any given value of the dependent variable, regression analysis allows us to define the model in terms of the simple slope-intercept form of a linear equation:
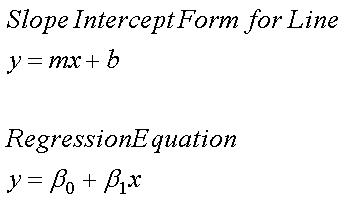
In that form, "m" is the slope of the line (the change in Y per unit change in X), and "b" is the "intercept" term, or the value for Y when X = 0. By convention, in regression analysis, the slope of the line is often referred to as the "regression coefficient" and represented by the lower case Greek letter beta (ß) with s subscript of 1, and the intercept term is often represented by the lower case Greek letter beta (ß) with s subscript of 0.
This equation then determines the estimated "Y" ("Y hat") for any given value of "X":
In that equation, the regression coefficient (or slope, m) and the intercept (b) are givens; substituting the given value for X then determines the estimated value for Y. The epsilon represents the residual, or error term: the estimated value may differ from an actual, observed value for Y at that given value of X.
In a simple linear regression model, with just a single independent variable, the following equations describe how to calculate the regression coefficient and intercept for a given set of data:
In addition to those values, in regression analysis it is typical to calculate additional statistics that describe the quality of the regression model. The first of these is the coefficient of determination, usually labeled "r squared". The coefficient of determination is the proportion of the variance in the observed values of the dependent variable that is explained by the regression model. Thus, for example, if the coefficient of determination is 0.75, then approximately 75% of the variance in Y is explained by the regression model. The following formula calculates the coefficient of determination for a simple linear model:
Statisticians will also typically compute the standard error for the regression model itself (often referred to as the standard error of the residuals), as well as standard error values for the regression coefficient ("ß sub 1) and the intercept term ("ß sub zero"):
With these standard error values calculated, one may now test the regression coefficient and the intercept term for statistical significance--that is, determine the likelihood that the regression coefficient and intercept values arose by chance, and thus have no efficacy for use in estimating the dependent variable. This is usually done by computing the value of the t statistic, which in this case is simply the quotient of the regression coefficient or intercept value and the applicable standard error for that value:
The t statistic value indicates the degree of confidence in the result--that is, the probability that the result is not an artifact of chance. The confidence level is determined by the value of the t statistic and the number of degrees of freedom for the regression model. (In linear regression, the degrees of freedom are always the number of observed data points, minus the number of idependent variables, minus one.) The table below illustrates the t statistic values associated with commonly-used confidence levels, by degrees of freedom:
Simple Linear Regression Analysis Using Native Jet SQL
It is possible to compute all of the various regression statistics described above using solely native Jet SQL, the SQL dialect for Access's Jet database engine. However, just as the formulas used to calculate these values can be quite complex, the SQL statements required for these calculation are not for the faint of heart.
In the attached Access database, I provide three sample data sets, and for each data set I calculate the regression coefficient, the intercept, and the r-squared value, with these statistics provided for:
Each complete data set, taken as a whole
With each data set, subsets based on the "Code" column
With each data set, subsets based on the "Section" column
With each data set, subsets based on the combination of the "Section" and "Code" columns
In the simplest case, that for a complete data set, the SQL statement is as follows for "Set1":
SELECT (Avg(X * Y) - Avg(X) * Avg(Y)) ^ 2 / (VarP(X) * VarP(Y)) AS RSquared,
                          (Avg(X * Y) - Avg(X) * Avg(Y)) / VarP(X) AS RegressCoeff,
                          Avg(Y) - ((Avg(X * Y) - Avg(X) * Avg(Y)) / VarP(X)) * Avg(X) AS Intercept,
                          ((Count(X) / (Count(X) - 2)) * (VarP(Y) - (Avg(X * Y) - Avg(X) * Avg(Y)) ^ 2 / VarP(X))) ^ 0.5 AS SE_Resid,
                          ((1 / (VarP(X) * (Count(X) - 2))) * (VarP(Y) - (Avg(X * Y) - Avg(X) * Avg(Y)) ^ 2 / VarP(X))) ^ 0.5 AS SE_XCoeff,
                          ((1 / (Count(X) - 2)) * (VarP(Y) - ((Avg(X * Y) - Avg(X) * Avg(Y)) ^ 2 / VarP(X))) * ((VarP(X) + Avg(X) ^ 2) / VarP(X))) ^ 0.5 AS SE_Intercept,
                          ((Avg(X * Y) - Avg(X) * Avg(Y)) / VarP(X)) / (((1 / (VarP(X) * (Count(X) - 2))) * (VarP(Y) - (Avg(X * Y) - Avg(X) * Avg(Y)) ^ 2 / VarP(X))) ^ 0.5) AS T_XCoeff,
                          (Avg(Y) - ((Avg(X * Y) - Avg(X) * Avg(Y)) / VarP(X)) * Avg(X)) / (((1 / (Count(X) - 2)) * (VarP(Y) - ((Avg(X * Y) - Avg(X) * Avg(Y)) ^ 2 / VarP(X))) * ((VarP(X) + Avg(X) ^ 2) / VarP(X))) ^ 0.5) AS T_Intercept
FROM Set1;To calculate regression statistics for subsets of the data, simply take the staement above, and add the columns that define the subsets to the SELECT and GROUP BY clauses:
By Code:

                      SELECT Code,
                          (Avg(X * Y) - Avg(X) * Avg(Y)) ^ 2 / (VarP(X) * VarP(Y)) AS RSquared,
                          (Avg(X * Y) - Avg(X) * Avg(Y)) / VarP(X) AS RegressCoeff,
                          Avg(Y) - ((Avg(X * Y) - Avg(X) * Avg(Y)) / VarP(X)) * Avg(X) AS Intercept,
                          ((Count(X) / (Count(X) - 2)) * (VarP(Y) - (Avg(X * Y) - Avg(X) * Avg(Y)) ^ 2 / VarP(X))) ^ 0.5 AS SE_Resid,
                          ((1 / (VarP(X) * (Count(X) - 2))) * (VarP(Y) - (Avg(X * Y) - Avg(X) * Avg(Y)) ^ 2 / VarP(X))) ^ 0.5 AS SE_XCoeff,
                          ((1 / (Count(X) - 2)) * (VarP(Y) - ((Avg(X * Y) - Avg(X) * Avg(Y)) ^ 2 / VarP(X))) * ((VarP(X) + Avg(X) ^ 2) / VarP(X))) ^ 0.5 AS SE_Intercept,
                          ((Avg(X * Y) - Avg(X) * Avg(Y)) / VarP(X)) / (((1 / (VarP(X) * (Count(X) - 2))) * (VarP(Y) - (Avg(X * Y) - Avg(X) * Avg(Y)) ^ 2 / VarP(X))) ^ 0.5) AS T_XCoeff,
                          (Avg(Y) - ((Avg(X * Y) - Avg(X) * Avg(Y)) / VarP(X)) * Avg(X)) / (((1 / (Count(X) - 2)) * (VarP(Y) - ((Avg(X * Y) - Avg(X) * Avg(Y)) ^ 2 / VarP(X))) * ((VarP(X) + Avg(X) ^ 2) / VarP(X))) ^ 0.5) AS T_Intercept
                      FROM Set1
                      GROUP BY Code;

                      By Section:

                      SELECT Section,
                          (Avg(X * Y) - Avg(X) * Avg(Y)) ^ 2 / (VarP(X) * VarP(Y)) AS RSquared,
                          (Avg(X * Y) - Avg(X) * Avg(Y)) / VarP(X) AS RegressCoeff,
                          Avg(Y) - ((Avg(X * Y) - Avg(X) * Avg(Y)) / VarP(X)) * Avg(X) AS Intercept,
                          ((Count(X) / (Count(X) - 2)) * (VarP(Y) - (Avg(X * Y) - Avg(X) * Avg(Y)) ^ 2 / VarP(X))) ^ 0.5 AS SE_Resid,
                          ((1 / (VarP(X) * (Count(X) - 2))) * (VarP(Y) - (Avg(X * Y) - Avg(X) * Avg(Y)) ^ 2 / VarP(X))) ^ 0.5 AS SE_XCoeff,
                          ((1 / (Count(X) - 2)) * (VarP(Y) - ((Avg(X * Y) - Avg(X) * Avg(Y)) ^ 2 / VarP(X))) * ((VarP(X) + Avg(X) ^ 2) / VarP(X))) ^ 0.5 AS SE_Intercept,
                          ((Avg(X * Y) - Avg(X) * Avg(Y)) / VarP(X)) / (((1 / (VarP(X) * (Count(X) - 2))) * (VarP(Y) - (Avg(X * Y) - Avg(X) * Avg(Y)) ^ 2 / VarP(X))) ^ 0.5) AS T_XCoeff,
                          (Avg(Y) - ((Avg(X * Y) - Avg(X) * Avg(Y)) / VarP(X)) * Avg(X)) / (((1 / (Count(X) - 2)) * (VarP(Y) - ((Avg(X * Y) - Avg(X) * Avg(Y)) ^ 2 / VarP(X))) * ((VarP(X) + Avg(X) ^ 2) / VarP(X))) ^ 0.5) AS T_Intercept
                      FROM Set1
                      GROUP BY Section;

                      By Section and Code:

                      SELECT Section,
                          Code,
                          (Avg(X * Y) - Avg(X) * Avg(Y)) ^ 2 / (VarP(X) * VarP(Y)) AS RSquared,
                          (Avg(X * Y) - Avg(X) * Avg(Y)) / VarP(X) AS RegressCoeff,
                          Avg(Y) - ((Avg(X * Y) - Avg(X) * Avg(Y)) / VarP(X)) * Avg(X) AS Intercept,
                          ((Count(X) / (Count(X) - 2)) * (VarP(Y) - (Avg(X * Y) - Avg(X) * Avg(Y)) ^ 2 / VarP(X))) ^ 0.5 AS SE_Resid,
                          ((1 / (VarP(X) * (Count(X) - 2))) * (VarP(Y) - (Avg(X * Y) - Avg(X) * Avg(Y)) ^ 2 / VarP(X))) ^ 0.5 AS SE_XCoeff,
                          ((1 / (Count(X) - 2)) * (VarP(Y) - ((Avg(X * Y) - Avg(X) * Avg(Y)) ^ 2 / VarP(X))) * ((VarP(X) + Avg(X) ^ 2) / VarP(X))) ^ 0.5 AS SE_Intercept,
                          ((Avg(X * Y) - Avg(X) * Avg(Y)) / VarP(X)) / (((1 / (VarP(X) * (Count(X) - 2))) * (VarP(Y) - (Avg(X * Y) - Avg(X) * Avg(Y)) ^ 2 / VarP(X))) ^ 0.5) AS T_XCoeff,
                          (Avg(Y) - ((Avg(X * Y) - Avg(X) * Avg(Y)) / VarP(X)) * Avg(X)) / (((1 / (Count(X) - 2)) * (VarP(Y) - ((Avg(X * Y) - Avg(X) * Avg(Y)) ^ 2 / VarP(X))) * ((VarP(X) + Avg(X) ^ 2) / VarP(X))) ^ 0.5) AS T_Intercept
                      FROM Set1
GROUP BY Section, Code;For those examples, please note the following:
All of the examples use Set1 as the source table. To use Set2 instead, simply replace all references to Set1 with Set2
In Set3, the linear relationship is not between X and Y, but rather between the natural logarithm of X and Y. Thus, to use Set3 instead, replace all references to Set1 with Set3, and replace all references to X with Log(X)
While all of these regression statistics can be calculated using only native Jet SQL, the formulas are quite complex. The resulting SQL statements would be long and, to most users, probably incomprehensible, and thus, to perform regression analysis in Access, I recommend using a VBA-powered approach as demonstrated below.
Simple Linear Regression Analysis Using DSimpleRegress
To facilitate simple linear regression analysis in Access, I have developed a new user defined function, DSimpleRegress. This function computes the various regression statistics described in the Basics of Linear Regression Analysis section of this article, and eliminates the need to employ complicated SQL statements.
For example, the following SQL statement calculates the full spread of regression statistics for the entire data set, in a much simpler fashion than by the "pure SQL" approach:
SELECT DSimpleRegress("X","Y","Set1","",1) AS RSquared,
                          DSimpleRegress("X","Y","Set1","",2) AS XCoeff,
                          DSimpleRegress("X","Y","Set1","",3) AS Intercept,
                          DSimpleRegress("X","Y","Set1","",4) AS SE_Resid,
                          DSimpleRegress("X","Y","Set1","",5) AS SE_XCoeff,
                          DSimpleRegress("X","Y","Set1","",6) AS SE_Intercept,
                          DSimpleRegress("X","Y","Set1","",7) AS T_XCoeff,
DSimpleRegress("X","Y","Set1","",8) AS T_Intercept;Further, the SQL statements required to capture the various subsets of data are also much simplified:
By Code:

                      SELECT Set1.Code,
                          DSimpleRegress("X","Y","Set1","[Code] = '" & Code & "'",1) AS RSquared,
                          DSimpleRegress("X","Y","Set1","[Code] = '" & Code & "'",2) AS XCoeff,
                          DSimpleRegress("X","Y","Set1","[Code] = '" & Code & "'",3) AS Intercept,
                          DSimpleRegress("X","Y","Set1","[Code] = '" & Code & "'",4) AS SE_Resid,
                          DSimpleRegress("X","Y","Set1","[Code] = '" & Code & "'",5) AS SE_XCoeff,
                          DSimpleRegress("X","Y","Set1","[Code] = '" & Code & "'",6) AS SE_Intercept,
                          DSimpleRegress("X","Y","Set1","[Code] = '" & Code & "'",7) AS T_XCoeff,
                          DSimpleRegress("X","Y","Set1","[Code] = '" & Code & "'",8) AS T_Intercept
                      FROM Set1
                      GROUP BY Set1.Code;

                      By Section:

                      SELECT Section,
                          DSimpleRegress("X","Y","Set1","[Section] = '" & Section & "'",1) AS RSquared,
                          DSimpleRegress("X","Y","Set1","[Section] = '" & Section & "'",2) AS XCoeff,
                          DSimpleRegress("X","Y","Set1","[Section] = '" & Section & "'",3) AS Intercept,
                          DSimpleRegress("X","Y","Set1","[Section] = '" & Section & "'",4) AS SE_Resid,
                          DSimpleRegress("X","Y","Set1","[Section] = '" & Section & "'",5) AS SE_XCoeff,
                          DSimpleRegress("X","Y","Set1","[Section] = '" & Section & "'",6) AS SE_Intercept,
                          DSimpleRegress("X","Y","Set1","[Section] = '" & Section & "'",7) AS T_XCoeff,
                          DSimpleRegress("X","Y","Set1","[Section] = '" & Section & "'",8) AS T_Intercept
                      FROM Set1
                      GROUP BY Section;

                      By Section and Code:

                      SELECT Set1.Section, Set1.Code,
                          DSimpleRegress("X","Y","Set1","[Section] = '" & Section & "' And [Code] = '" & Code & "'",1) AS RSquared,
                          DSimpleRegress("X","Y","Set1","[Section] = '" & Section & "' And [Code] = '" & Code & "'",2) AS XCoeff,
                          DSimpleRegress("X","Y","Set1","[Section] = '" & Section & "' And [Code] = '" & Code & "'",3) AS Intercept,
                          DSimpleRegress("X","Y","Set1","[Section] = '" & Section & "' And [Code] = '" & Code & "'",4) AS SE_Resid,
                          DSimpleRegress("X","Y","Set1","[Section] = '" & Section & "' And [Code] = '" & Code & "'",5) AS SE_XCoeff,
                          DSimpleRegress("X","Y","Set1","[Section] = '" & Section & "' And [Code] = '" & Code & "'",6) AS SE_Intercept,
                          DSimpleRegress("X","Y","Set1","[Section] = '" & Section & "' And [Code] = '" & Code & "'",7) AS T_XCoeff,
                          DSimpleRegress("X","Y","Set1","[Section] = '" & Section & "' And [Code] = '" & Code & "'",8) AS T_Intercept
                      FROM Set1
GROUP BY Set1.Section, Set1.Code;For those examples, please note the following:
All of the examples use Set1 as the source table. To use Set2 instead, simply replace all references to Set1 with Set2
In Set3, the linear relationship is not between X and Y, but rather between the natural logarithm of X and Y. Thus, to use Set3 instead, replace all references to Set1 with Set3, and replace all references to X with Log(X)
DSimpleRegress Source Code
DSimpleRegress is designed to behave similarly to the so-called "domain aggregate" functions in Access, such as DSum, DCount, DAvg, etc. It takes the following arguments:
X_Column is the name column storing the values for the independent variable
Y_Column is the name column storing the values for the dependent variable
Tbl is the name of the table of the query storing the source data for the regression analysis
Criteria is an optional argument supplying any criteria that may be applied in selecting the data on which to perform the regression analysis
Stat is an optional argument indicating which regression statistic shall be returned
Notes on names and qualifiers:
In the X_Column, Y_Column, Tbl, and Criteria arguments, it is highly recommended that you enclose all database object names with square brackets
In the Criteria argument, be sure to qualify text entries with single quotes, and date/time values with the # character
For the Stat argument, the following values are associated with the following statistics:
"1", "r squared", "rsquared", "r sq", "rsq", "r square", "rsquare", "r-squared", "r-sq", "r-square": coefficient of determination, or r-squared
"2", "x", "x coefficient", "x coeff", "xcoeff", "coeff", "coefficient": regression coefficient
"3", "intercept", "constant": intercept
"4", "se model", "se regression", "se resid", "se residual", "se residuals", "std error model", "std error regression", "std error resid", "std error residual", "std error residuals", "standard error model", "standard error regression", "standard error resid", "standard error residual", "standard error residuals": standard error residuals
"5", "se x", "se x coefficient", "se x coeff", "se xcoeff", "se coeff", "se coefficient", "std error x", "std error x coefficient", "std error x coeff", "std error xcoeff", "std error coeff", "std error coefficient", "standard error x", "standard error x coefficient", "standard error x coeff", "standard error xcoeff", "standard error coeff", "standard error coefficient": standard error of the regression coefficient
"6", "se intercept", "se constant", "std error intercept", "std error constant", "standard error intercept", "standard error constant": standard error of the intercept
"7", "t x", "t x coefficient", "t x coeff", "t xcoeff", "t coeff", "t coefficient": t statistic for the regression coefficient
"8", "t intercept", "t constant": t statistic for the intercept
Anything else, or omitted: function returns a 1-based array of all the statistics, in the order presented above
To implement DSimpleRegress in your Access project, simply copy the code below into a regular VBA module, and then use it in your queries, forms, reports, and/or other VBA procedures.
' Enumeration used for determining which regression stat(s) the DSimpleRegress function returns
Enum SimpleRegressStat
SimpleRegressStat_All = 0
SimpleRegressStat_RSquared = 1
SimpleRegressStat_XCoeff = 2
SimpleRegressStat_Intercept = 3
SimpleRegressStat_SE_Resid = 4
SimpleRegressStat_SE_XCoeff = 5
SimpleRegressStat_SE_Intercept = 6
SimpleRegressStat_T_XCoeff = 7
SimpleRegressStat_T_Intercept = 8
End Enum
Function DSimpleRegress(X_Column As String, Y_Column As String, Tbl As String, _
Optional Criteria As String = "", Optional Stat As Variant = "")
' Function by Patrick G. Matthews
' Feel free to use and distribute this code, so long as you credit authorship and indicate the
' URL where you found it
' This function calculates statistics for simple linear regression between a single independent
' variable (X_Column) and a dependent variable (Y_Column), and is intended for use in Microsoft
' Access. This function requires a reference to the Microsoft DAO library.
' Depending on the value of the Stat argument, this function returns a single regression
' statistic, such as the R squared or the X coefficient, or it returns an array of all
' available regression stats (for a list of available stats, please see the enumeration
' SimpleRegressStat)
' If either or both corresponding values in the paired X, Y data set are null, those records
' are ignored
' This function is labeled according to the domain aggregate function naming convention as it
' behaves similarly to the other domain aggregates
' X_Column is the independent variable
' Y_Column is the dependent variable
' Tbl is the source table or query for the data
' Criteria defines any filtering criteria you wish to apply to the data set. Be sure to enclose
' text items in single quotes and date values in the # date qualifiers
' Stat determines which regression statistic the function returns. For a full list of the valid
' values (NOT case sensitive) for the Stat argument, see the Select Case structure under
' the label DetermineMode
' For each of the arguments, I strongly recommend that you encase column and table names in
' square brackets. This is mandatory of the column/table name does not follow the usual rules
' for naming database objects
Static Last_X_Column As String
Static Last_Y_Column As String
Static Last_Tbl As String
Static Last_Criteria As String
Static Last_Runtime As Date
Static Result_RSquared As Variant
Static Result_XCoeff As Variant
Static Result_Intercept As Variant
Static Result_SE_Resid As Variant
Static Result_SE_XCoeff As Variant
Static Result_SE_Intercept As Variant
Static Result_T_XCoeff As Variant
Static Result_T_Intercept As Variant
Dim N As Long
Dim AvgX As Variant
Dim AvgY As Variant
Dim AvgXY As Variant
Dim VarPX As Variant
Dim VarPY As Variant
Dim Covar As Variant
Dim SQL As String
Dim rs As DAO.Recordset
Dim Mode As SimpleRegressStat
Dim Results(1 To 8) As Variant
Const ForceRefreshSeconds As Long = 30
On Error GoTo ErrHandler
DetermineMode:
' Determines whether a single regression stat is returned (and if so, which), or whether
' an array of all available stats is returned
Select Case LCase(Stat)
Case "1", "r squared", "rsquared", "r sq", "rsq", "r square", "rsquare", "r-squared", "r-squared", _
"r-sq", "r-sq", "r-square", "r-square"
Mode = SimpleRegressStat_RSquared
Case "2", "x", "x coefficient", "x coeff", "xcoeff", "coeff", "coefficient"
Mode = SimpleRegressStat_XCoeff
Case "3", "intercept", "constant"
Mode = SimpleRegressStat_Intercept
Case "4", "se model", "se regression", "se resid", "se residual", "se residuals", "std error model", _
"std error regression", "std error resid", "std error residual", "std error residuals", _
"standard error model", "standard error regression", "standard error resid", _
"standard error residual", "standard error residuals"
Mode = SimpleRegressStat_SE_Resid
Case "5", "se x", "se x coefficient", "se x coeff", "se xcoeff", "se coeff", "se coefficient", _
"std error x", "std error x coefficient", "std error x coeff", "std error xcoeff", _
"std error coeff", "std error coefficient", "standard error x", "standard error x coefficient", _
"standard error x coeff", "standard error xcoeff", "standard error coeff", _
"standard error coefficient"
Mode = SimpleRegressStat_SE_XCoeff
Case "6", "se intercept", "se constant", "std error intercept", "std error constant", _
"standard error intercept", "standard error constant"
Mode = SimpleRegressStat_SE_Intercept
Case "7", "t x", "t x coefficient", "t x coeff", "t xcoeff", "t coeff", "t coefficient"
Mode = SimpleRegressStat_T_XCoeff
Case "8", "t intercept", "t constant"
Mode = SimpleRegressStat_T_Intercept
Case Else
Mode = SimpleRegressStat_All
End Select
CalculateStats:
' Calculate the regression stats
' This function holds the regression stats in static variables, which retain their state
' between calls. If the values for the X_Column, Y_Column, Tbl, and Criteria arguments
' are the same as those for the last call, and if the seconds elapsed since the last
' call are less than what is specified in the ForceRefreshSeconds constant, then we can
' skip the calculations and go right to assigning the return value
If DateDiff("s", Last_Runtime, Now) >= ForceRefreshSeconds Or Last_X_Column <> X_Column Or _
Last_Y_Column <> Y_Column Or Last_Tbl <> Tbl Or Last_Criteria <> Criteria Then
' Initialize stats to null
Result_RSquared = Null
Result_XCoeff = Null
Result_Intercept = Null
Result_SE_Resid = Null
Result_SE_XCoeff = Null
Result_SE_Intercept = Null
Result_T_XCoeff = Null
Result_T_Intercept = Null
' All the regression stats can be calculated from the following six values: N, Avg(X), Avg(Y),
' Avg(X * Y), VarP(X), and VarP(Y). Use the following SQL statement to get these six values
SQL = "SELECT Count(1) AS N, Avg(" & X_Column & ") AS AvgX, Avg(" & Y_Column & ") AS AvgY, " & _
"Avg(" & X_Column & " * " & Y_Column & ") AS AvgXY, VarP(" & X_Column & ") AS VarPX, " & _
"VarP(" & Y_Column & ") AS VarPY " & _
"FROM " & Tbl & " " & _
"WHERE " & IIf(Trim(Criteria) <> "", Criteria & " And ", "") & X_Column & " Is Not Null " & _
"And " & Y_Column & " Is Not Null"
Set rs = CurrentDb.OpenRecordset(SQL, dbOpenSnapshot)
' Transfer values from recordset to variables, then close recordset
AvgX = CDbl(rs!AvgX)
AvgY = CDbl(rs!AvgY)
AvgXY = CDbl(rs!AvgXY)
N = rs!N
VarPX = CDbl(rs!VarPX)
VarPY = CDbl(rs!VarPY)
Covar = AvgXY - AvgX * AvgY
rs.Close
' There must be at least 3 valid data points for regression to work. If there are 2 or
' fewer data points, we skip the rest of the calculations, thus allowing the regression
' stats to remain as null
If N > 2 Then
' Calculate various stats
Result_RSquared = Covar ^ 2 / (VarPX * VarPY)
Result_XCoeff = Covar / VarPX
Result_Intercept = AvgY - AvgX * Result_XCoeff
Result_SE_Resid = ((N / (N - 2)) * (VarPY - Covar ^ 2 / VarPX)) ^ 0.5
Result_SE_XCoeff = Result_SE_Resid * (1 / (N * VarPX)) ^ 0.5
Result_SE_Intercept = Result_SE_Resid * ((VarPX + AvgX ^ 2) / (N * VarPX)) ^ 0.5
Result_T_XCoeff = Result_XCoeff / Result_SE_XCoeff
Result_T_Intercept = Result_Intercept / Result_SE_Intercept
End If
End If
ReturnValue:
' Set the fnction's return value
Select Case Mode
Case SimpleRegressStat_All
Results(1) = Result_RSquared
Results(2) = Result_XCoeff
Results(3) = Result_Intercept
Results(4) = Result_SE_Resid
Results(5) = Result_SE_XCoeff
Results(6) = Result_SE_Intercept
Results(7) = Result_T_XCoeff
Results(8) = Result_T_Intercept
DSimpleRegress = Results
Case SimpleRegressStat_RSquared
DSimpleRegress = Result_RSquared
Case SimpleRegressStat_XCoeff
DSimpleRegress = Result_XCoeff
Case SimpleRegressStat_Intercept
DSimpleRegress = Result_Intercept
Case SimpleRegressStat_SE_Resid
DSimpleRegress = Result_SE_Resid
Case SimpleRegressStat_SE_XCoeff
DSimpleRegress = Result_SE_XCoeff
Case SimpleRegressStat_SE_Intercept
DSimpleRegress = Result_SE_Intercept
Case SimpleRegressStat_T_XCoeff
DSimpleRegress = Result_T_XCoeff
Case SimpleRegressStat_T_Intercept
DSimpleRegress = Result_T_Intercept
End Select
Last_Runtime = Now
GoTo Cleanup
ErrHandler:
DSimpleRegress = CVErr(Err.Number)
Cleanup:
Set rs = Nothing
End FunctionSample Files
This article includes two sample files, an Access database and an Excel workbook.
The Access database contains three tables, Set1, Set2, and Set3
For each of these tables, there are eight queries. Four of these queries illustrate computation of the regression statistics using a pure SQL approach on the whole data set as well as various subsets. The other four queries illustrate the same computations using the DSimpleRegress function provided in this article
The Excel workbook contains three worksheets, aligned to the three tables in the Access database and containing the same data. These worksheets illustrate similar calculations using native Excel formulas
Stats-Part-3.mdb
Stats-Article-Part-3.xls
Limitations of this Approach
Three significant limitations constrain the approach described here:
This approach supports only a single independent variable
This approach only works when the relationship between the independent variable and the dependent variable is linear, or when a transformation can be performed on the independent variable such that the transformed values and the dependent variable have a linear relationship
This approach does not allow the user to fix the intercept value at zero
Thus, for example, while it is possible to use this approach to run a regression analysis on years of education (independent variable) and salary (dependent variable), it is not possible to run a regression analysis on years of education and years of experience (independent variables) and salary (dependent variable).
Further, this approach cannot be applied to analyze non-linear relationships. However, if the independent variable can be transformed to produce a linear relationship, then this approach can be used. For example, in Set3 in the sample Access database and Excel workbook, Y is related to the natural logarithm of X, as shown in the charts below:
Other Products
While this method is suitable for simple linear regression, if any of the limitations described above apply, then you may want to consider using another product:
Minitab is a full-purpose statistical analysis software package. I highly recommend it for any multiple regression analysis, as it automatically detects and handles multicollinearity. It is expensive, but in my opinion worthwhile for anyone having to do serious statistical analysis
SAS Analytics Pro is an enterprise scale statistical software package
NCSS is another full-service statistical package
Total Access Statistics is an add-in for Access that computes a wide array of statistics in addition to regression analysis
Microsoft Excel can perform multiple regression analysis with up to 16 independent variables. However, under some circumstances, Excel's regression results can be unreliable, especially when trying to fix the intercept value at zero
SPC for Excel is an add-in for Excel that produces accurate results, avoids Excel's limitation on independent variables, and tests for (but does not automatically handle) multicollinearity
Acknowledgments
Special thanks go out to EE Member and Page Editor harfang. When I originally posted this article, I used a correct but sub-optimal approach to calculating the regression statistics. With harfang's suggestions, I have been able to streamline the calculations, and significantly simplify the VBA code.
=-=-=-=-=-=-=-=-=-=-=-=-=-
If you liked this article and want to see more from this author, please click here.
If you found this article helpful, please click the Yes button near the:
Was this article helpful?
label that is just below and to the right of this text. Thanks!
=-=-=-=-=-=-=-=-=-=-=-=-=-
Have a question about something in this article? You can receive help directly from the article author. Sign up for a free trial to get started.
Comments (4)
Author
Commented:The SQL examples, Access sample file, and VBA code have all been updated, using closer-to-optimal calculation techniques graciously suggested by harfang.
BTW, one additional calculation that did not make it into the article is how to calculate the slope when the regression line is forced through the origin. The formula for that is:
slope = Sum(X * Y) / Sum(X ^ 2)
In SQL:
Open in new window
Cheers,
Patrick
Commented:
Great article! It covers one topic, completely, and well. The formulas are presented with just the right amount of explanations (and they were correct before the last update, as you well know). I have the feeling I will be glad to copy-and-paste from it for myself sometime soon, or point readers to it.
Markus -- (°v°)
Commented:
Example:
Open in new window
If you like that result, I would suggest playing with doing a similar VarP() and Count(x) expression substitutions like I did with Term1.Open in new window
If you do, please let me know about any performance gains.Commented:
This may not be the place to ask this question, but here goes.
I'm trying to use the vba function in standard vba (rather than part of an sql statement).
It seems to be reading the function and executing, but i keep getting the 3115 error code.
Any recommendations on what i need to define my variable name as (variant?, double?, etc.) to get it to work out?
Any advice is appreciated.
Thanks!