Getting your EE Ranking statistics in Excel - The Next Generation


Preface
This Article is a replacement of http:/A_1788-Getting-your-EE-Ranking-statistics-in-Excel.html. Changes in the way Experts Exchange delivers point statistics, implemented in July 2010, made this complete overhaul necessary, and I decided to spawn a new Article for the sake of clarity and reference.
I'm trying to (re-)cover all areas of the predecessor first, for all those of you who did not use the Excel sheet before. So that sections can be read diagonally for the "experienced users" (I tried to keep it as close as possible to the predecessor to make that easy).
Then I'll show the differences, and how to incorporate the valuable historical data obtained previously and no longer available yet.
Since VBA is required, the method described will not work for Office 2008 for Mac, which has no VBA. The only way to have a similar result is to create the required Web Queries yourself, and replace some of the code with Excel formulas - doable, but very time consuming to set up.
Target
For all Experts out there who keep a record of the points they get, and do that manually, here is a way how to obtain the data automatically - as far as possible.
Because of the nature of the new ranking statistic pages, you need to get them in time. You cannot go back one week or month or year anymore, as it was possible before the major change in July 2010. Hence it is important to collect data regularly, else you get inaccurate statistics. If that happens, just adjust the previously retrieved data as far as you can and need. E.g. if you have all statistics, and missed points of the last days of the month, you can obtain the corrections by substracting the recent month values from the monthly or yearly ones to get the previous.
The technique used here is based on Web Queries, which pull table-like data from Web pages.
The framework I provide here as an Excel Worksheet will allow for filling in as much data as possible. To keep track of overall points, which are not the total of all zone points as you certainly know, you have still to query and enter it manually for past periods. There is no magic wand used, and hence nothing you can't do on your own - with one exception: the JavaScript methods used do not allow for using Web Queries. The Web Query compatible URL used instead is not supported by EE, but works great.
You should need only basic Excel skills to use this spreadsheet (though understanding will need some more skills, but it is not really difficult).
Important:
Remember to have the "Remember Me" setting enabled in your web login to Experts Exchange via Internet Explorer. Otherwise, you will get no data at all (only members are allowed to see the ranking tables).
The Worksheets
The Workbook as provided here contains no data. Some of the screenshots shown below contain a small subset of real-life data (of me), but are for visualization purpose only.
The following worksheets are the "important" ones:
Setup contains some setup data, like your Expert name, number of entries to read, and some more we will cover later. The buttons you should use to auto-fill of the other worksheets are located here, too.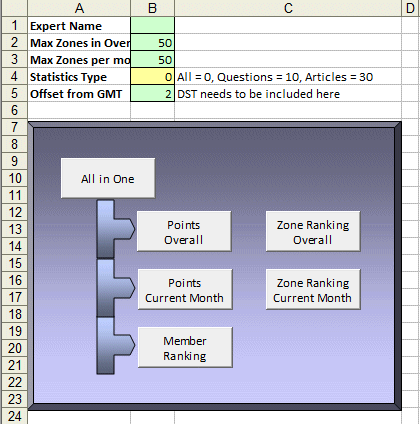 Overall will be filled with the data of all-time points reached in each zone.
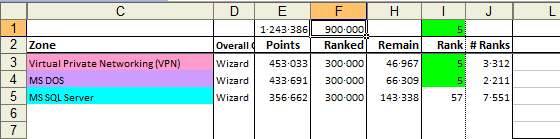 Month is the template worksheet for individual months.
 Ranking collects data of each month's worksheet.
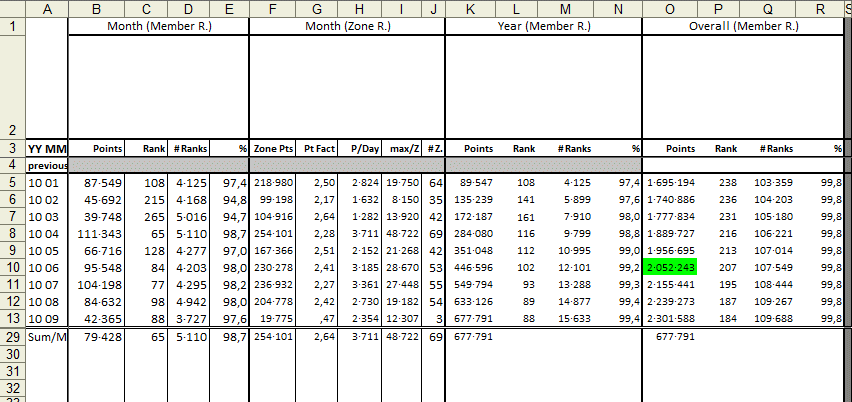
Ranking needs some further explanation...
Besides the data that is filled out semi-automatically based on the formulas referring to months' worksheets (shown for an example matrix of 3 zones), it allows for manual record keeping of overall statistics not retrievable automatically. That is, only data for the current month and year can be queried using the Web interface, and if you haven't been quick enough and waiting too long, last month's data is unreachable. I will describe in detail what is done automatically, what you have to do first, and what to do for the unknown values of the past. In short, columns B to R of the current month, year and total are kept up-to-date by code.
The % columns stand for "Success rate". 95% would mean you are a top expert, with 95% of all contributing (!) members ranked worse than you. In other words, you are one of the 5% of top experts.
The Points column in Overall area allows for Overall milestones. As an example I have added conditional formatting, which colours the cell green on each 500 000 points boundary. The conditional formatting here should show just the idea how to use formulas to colour up your spreadsheet.
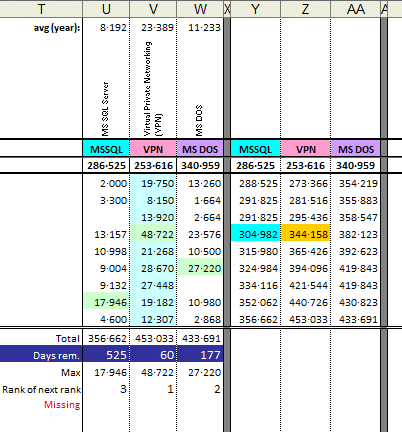
Those example columns for zones, starting at column T, you can see in the "Ranking Example Zones" screenshot have to be adapted to your needs. The first three are referring to the corresponding month's worksheet, looking up for the zone name noted in row 2 (exact match needed). Row 3 is a short name you can choose arbitrary; I usually hide row 2 and display only the short name.
You will also see some numbers in row 1 of each individual zone. That is the One-Year-Average of that zone, used in last row to get the approximated days for getting the next rank in that zone. Just a teaser ;-). The area OneYear is adapted automatically to the previous 12 months when you retrieve monthly statistics. At the beginning this area will be less than 12 months for the lack of data.
The "Rank of next rank" numbers below show in which probable order you will receive the next certificate, based on the one-year average in the respective zone. It will only display the Top Ten (the remaining ranks are made white on white to hide them).
The last 3 columns are for zone point aggregation. That helps for calculating the point in time you got a new rank, a million, or similar, in a zone. They are referring to the values in the corresponding columns of this worksheet by simple cell value accumulation.
You usually will put your own zones of interest in both the month and total area, which should be easy as you can just copy and insert the example columns, and change the zone names in rows 2 and 3.
The "previous" row is the subtotal of all values which are not retrieved. The white area needs to be filled out manually to make the statistics correct. This is most important for the last three example columns. The grey areas are not filled out usually.
The Zones column is just to keep track of how broad your pointing is spread over different zones. It counts values in the corresponding monthly worksheet - very simple, if you know how.
How to Auto-Fill
First, you will have to enter the Expert name. Open the Setup worksheet, and type the name in the empty green cell. If you forget this step - never mind, the VBA code checks for it, and will make it really obvious that you should enter something.
If you like, you can adjust the two green "Max Zones" cell values below the Expert Name, which limit the number of Overall Zone Ranking and Monthly Zone Ranking zones retrieved. Usually I set this to something small for quick updates, and at the beginning of a new month to a high value to get the final monthly stats.
The other two settings are discussed later.
Well, the time has come to let the "magic" work. Press the topmost button ("All in One"), and after a short time you should see the worksheets coming into live. Each worksheet is shown while the code works on it as visual feedback.
The "All in One" button retrieves all numbers of the current month and year, including the Member Ranking statistics available. This will be the button you use most often. A generated worksheet will look like this: 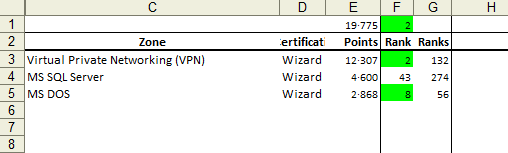 The other buttons are for starting individual actions, e.g. if you want to update only the Overall worksheet or the member ranking. The buttons located on the right get you the last rank in each zone you contributed in for the recent month or overall. Because it makes a difference if you are ranked 5 of 100 or 10 of 1000 ;-).
Instead of using the buttons, you are free to call the corresponding macros, or use the VBA Immediate Pane to start actions:
- open VBA Editor ([Alt F11]),
- open Immediate Pane ([Ctrl G]),
- and type
call getPointsOverallThis will be the same as pressing the "All in one" button.
I recommend fixing the values in the Ranking worksheet from time to time. The formulas used there have no meaning for static data, and the monthly sheets are static for the past - they cannot change once the month is gone, with exception of you adjusting them manually to apply e.g. revoked points when a question is reopened.
To remove the formulas, select the range you want to have the formulas removed, and call the Formula2Value macro (or press Ctrl-Shift-X). This will speed up Excel when changes are made, and reduce the file size.
Advanced users might want to integrate this step into the automation.
You might wonder about the TopicIDs sheet. It is needed for determining the TAID (zone ID) for Member and Zone Ranking calls. While they result in zone names they expect TAIDs for filtering. As noted in that sheet, the list of zones and their IDs is retrieved from http://www.ee-stuff.com/zonelist.php. If there should be a general zone revision just retrieve that list again, e.g. by using a WebQuery - you should now know how to do that ;-).
The Code behind the scenes
This section is for the more advanced users, and not necessary for utilizing the workbook. If you want to understand how all the stuff is done, read this section.
Option Explicit

Sub getPointsOverall()
  If Not WhoAmIFilled Then Exit Sub

  shOverall.Activate
  SetCalc False
  GetWebData shOverall.Cells(2, 1), [maxzones].Value
  ReSortZoneRankingData shOverall, [maxzones].Value
  SetCalc True
End Sub

Sub getPointsMonth()
  If Not WhoAmIFilled() Then Exit Sub

  Dim pot As Date
  pot = Now() - 2 - [TZOffset] / 24

  SetCalc False
  getMonthZoneRanks month(pot), year(pot)
  ReSortZoneRankingData ActiveSheet, [maxMonthZones].Value

  shRanking.Activate
  Dim oystart, oyend, offs As Integer
  offs = DateDiff("m", Range("A5").Value, pot) - 1
  oystart = Range("A5").row + WorksheetFunction.Max(0, offs - 12)
  oyend = Range("A5").row + offs
  Range(Cells(oystart, 1), Cells(oyend, 1)).EntireRow.Name = "OneYear"

  SetCalc True
End Sub

Sub getMemberRanking()
  Dim URL As String
  Dim qt As QueryTable
  URL = "http://e-e.com/shared/async/expertsZone/memberRank.jsp?expertName=" & [WhoAmI] & "&m_typeID=" & [StatsType]

  On Error Resume Next
  If [ScratchArea].Name = "" Then [Setup!G1].Name = "ScratchArea"
  On Error GoTo 0

  If [ScratchArea].Count = 1 Then
    Range([ScratchArea].Address, [ScratchArea].Offset(10, 4).Address).Name = "ScratchArea"
  End If

  [ScratchArea].Parent.Activate
  Set qt = [ScratchArea].Parent.QueryTables.Add(Connection:="URL;" & URL & "&m_periodID=0", Destination:=[ScratchArea])
  With qt
    .WebTables = 1
    .FillAdjacentFormulas = False
    .PreserveFormatting = True
    .AdjustColumnWidth = False
    .WebSelectionType = xlSpecifiedTables
    .WebFormatting = xlWebFormattingNone
    .WebPreFormattedTextToColumns = False
    .SaveData = False
    .BackgroundQuery = False
    .RefreshStyle = xlOverwriteCells
    .Refresh
  End With

  ' Some preparation for further processing
  With Application
    .DecimalSeparator = "."
    .ThousandsSeparator = "·"
    .UseSystemSeparators = False
  End With

  With [ScratchArea]
    .Offset(0, 1).Name = "Lookup"
    ' Copy rank to the end, else we cannot use VLookup
    .Range("E1:E11").Formula = "=" & [ScratchArea].Columns(1).Address
    ' Filter Expert in result rows
    .Range("A13:A15").Formula = "= IF(ISNA(VLOOKUP(WhoAmI, Lookup, 4, FALSE)), 0, VLOOKUP(WhoAmI, Lookup, 4, FALSE))"
    .Range("B13:B15").Formula = "= IF(ISNA(VLOOKUP(WhoAmI, Lookup, 1, FALSE)),"""", VLOOKUP(WhoAmI, Lookup, 1, FALSE))"
    .Range("C13:C15").Formula = "= IF(ISNA(VLOOKUP(WhoAmI, Lookup, 2, FALSE)),"""", VLOOKUP(WhoAmI, Lookup, 2, FALSE))"
    .Range("D13:D15").Formula = "= IF(ISNA(VLOOKUP(WhoAmI, Lookup, 3, FALSE)), 0, VLOOKUP(WhoAmI, Lookup, 3, FALSE))"
    .Range("E13").Value = "Overall"
    .Range("E14").Value = "Yearly"
    .Range("E15").Value = "Monthly"
  End With

  ' Now retrieve Overall, Year, Month
  [ScratchArea].Range("A13:E13").Select
  qt.Refresh
  Call Formula2Value

  [ScratchArea].Range("A14:E14").Select
  qt.Connection = "URL;" & URL & "&m_periodID=1"
  qt.Refresh
  Call Formula2Value

  [ScratchArea].Range("A15:E15").Select
  qt.Connection = "URL;" & URL & "&m_periodID=2"
  qt.Refresh
  Call Formula2Value

  ' Now tricky bit - get last rank by using very high starting rank
  ' URL = "http://www.experts-exchange.com/experts.jsp?etIndex=4"
  URL = "http://e-e.com/shared/async/expertsZone/memberRank.jsp?m_typeID=" & [StatsType]   ' 0: All, 10: Question, 30: Article

  With [ScratchArea].Range("F13")
    .Select
    qt.Connection = "URL;" & URL & "&m_periodID=0&hofStart=1000000"
    qt.Refresh
    .Value = [ScratchArea].Range("A2")
  End With

  With [ScratchArea].Range("F14")
    .Select
    qt.Connection = "URL;" & URL & "&m_periodID=1&hofStart=1000000"
    qt.Refresh
    .Value = [ScratchArea].Range("A2")
  End With

  With [ScratchArea].Range("F15")
    .Select
    qt.Connection = "URL;" & URL & "&m_periodID=2&hofStart=1000000"
    qt.Refresh
    .Value = [ScratchArea].Range("A2")
  End With

  ' Cleanup
  [Lookup].Name.Delete
  [ScratchArea].ClearContents
  qt.Delete

  ' Now we enter this into the Ranking worksheet
  With [Ranking!A5].Offset(DateDiff("m", [Ranking!A5], Now - 2 - [TZOffset] / 24))
    .Range("B1").Value = Replace([ScratchArea].Range("D15").Value, ",", "")
    .Range("C1").Value = [ScratchArea].Range("A15").Value
    .Range("D1").Value = Replace([ScratchArea].Range("F15").Value, ",", "")
    .Range("K1").Value = Replace([ScratchArea].Range("D14").Value, ",", "")
    .Range("L1").Value = [ScratchArea].Range("A14").Value
    .Range("M1").Value = Replace([ScratchArea].Range("F14").Value, ",", "")
    .Range("O1") = Replace([ScratchArea].Range("D13").Value, ",", "")
    .Range("P1") = [ScratchArea].Range("A13").Value
    .Range("Q1") = Replace([ScratchArea].Range("F13").Value, ",", "")
  End With

  Application.UseSystemSeparators = True
  shRanking.Select
End Sub

Sub getOverallZoneRanking()
  Call getZoneRanking("Overall", 0)
End Sub

Sub getMonthZoneRanking()
  Call getZoneRanking(year(Now() - 2 - [TZOffset] / 24) & " " & month(Now() - 2 - [TZOffset] / 24), 2)
End Sub

' --- Helper routines ---
Sub Formula2Value()
  Dim c As Range
  SetCalc False
  ActiveSheet.EnableCalculation = False
  For Each c In Selection
    c.Formula = c.Value
  Next c
  SetCalc True
End Sub

Sub SetCalc(calc As Boolean)
Dim ws As Worksheet
  For Each ws In Worksheets
    ws.EnableCalculation = calc
  Next ws
End Sub

Function WhoAmIFilled() As Boolean
  Dim ws As Worksheet
  With [WhoAmI]
    If .Value = "" Then
      shSetup.Activate
      .Activate
      .Interior.Color = RGB(255, 0, 0)
      .Offset(, 1).Value = "<--- Please enter your EE Member name!"
    Else
      .Interior.Color = .Offset(1, 0).Interior.Color
      .Offset(, 1).Clear
    End If
  End With
  WhoAmIFilled = [WhoAmI].Value <> ""
End Function

Sub GetWebData(rng As Range, zones As Long, Optional month As Integer = 0, Optional year As Integer)

  Dim URL As String
  URL = "http://e-e.com/shared/async/expertsZone/zoneRank.jsp?etIndex=3&expertName=" & [WhoAmI].Value _
      & "&typeID=" & [StatsType] & "&zoneID=0&subZoneID=0&zrOrderBy=-1&zrSort=-1"
  ' All: typeID=0   Q's only: typeID=10    Articles: typeID=30

  If month <> 0 Then URL = URL & "&periodID=2" Else URL = URL & "&periodID=0" ' no specific month or year supported anymore
  zones = Int(zones / 10 + 1) * 10

  With Application
    .DecimalSeparator = "."
    .ThousandsSeparator = "·"
    .UseSystemSeparators = False
  End With

  Dim i As Long
  For i = 1 To zones Step 10
    With rng.Parent.QueryTables.Add(Connection:="URL;" & URL & "&zrStart=" & i, Destination:=rng.Cells(1.1 * i, 1))
      .Name = "zoneRank"
      .FieldNames = True
      .RowNumbers = False
      .FillAdjacentFormulas = False
      .PreserveFormatting = True
      .RefreshOnFileOpen = False
      .BackgroundQuery = False
      .RefreshStyle = xlOverwriteCells
      .SavePassword = False
      .SaveData = True
      .AdjustColumnWidth = False
      .RefreshPeriod = 0
      .WebSelectionType = xlSpecifiedTables
      .WebFormatting = xlWebFormattingNone
      .WebTables = 1
      .WebPreFormattedTextToColumns = True
      .WebConsecutiveDelimitersAsOne = True
      .WebSingleBlockTextImport = False
      .WebDisableDateRecognition = False
      .WebDisableRedirections = False
      .Refresh
    End With
    If i > 1 Then
      If rng.Cells(i * 1.1 + 1, [Zone].Column).Value = rng.Cells(i * 1.1 - 1, [Zone].Column).Value Then
        rng.Range(Cells(i * 1.1 + 1, 1), Cells(i * 1.1 + 1, 5)).Value = ""
        Exit For
      End If
    End If
    If rng.Cells((i + 10 - 1) * 1.1, 2).Value = "" Then Exit For
  Next
  zones = i + 9
  For i = zones * 1.1 To 2 Step -1
    With rng.Cells(i, 4)
      If .Value = "No Certificates" Then .Value = " "
      If .Value = "Overall Certification Level" Then
        If i > 2 Then
          rng.Rows(i).Hidden = True
        End If
        .Offset(0, 1) = ""
        .Offset(0, 5) = ""
      Else
        ' This is for all those countries where a comma is not a thousands separator ...
        .Offset(0, 1).Value = Replace(.Offset(0, 1).Value, ",", "")
        .Offset(0, -3).Value = Replace(Replace(.Offset(0, -3).Value, ",", ""), ".", "")
        rng.Cells(i, [Rank].Column).Value = rng.Cells(i, 1).Value
      End If
    End With
  Next

  Dim qt As QueryTable
  For Each qt In ActiveSheet.QueryTables
    qt.Delete
  Next qt

  Application.UseSystemSeparators = True
End Sub

Sub ReSortZoneRankingData(ws As Worksheet, zones As Long)
  Dim row, c As Range
  Dim tmp2 As Integer
  Set row = [3:3]
  While row.Cells(, 2) <> "" And row.row < zones * 1.1 + 2
    row.Select
    If row.Cells(, 5) <> "" Then
      Set c = [ZoneRK].Find(row.Cells(, ws.Range("Zone").Column), , xlValues, xlWhole, xlByRows, xlNext)
      If c Is Nothing Then
        ' Zone rank info gets lost now for simplicity
        ' since we can't do an exchange of row data ...
        row.Cells(, [Ranks].Column).ClearContents
        row.Cells(, [ZoneRK].Column).ClearContents
      ElseIf c.row > row.row Then
        tmp2 = row.Cells(, [Ranks].Column)
        row.Cells(, [Ranks].Column) = c.Offset(, -1).Value
        c.Offset(, -1) = tmp2
        c = row.Cells(, [ZoneRK].Column)
      End If
    End If
    row.Cells(, [ZoneRK].Column) = row.Cells(, [Zone].Column)
    Set row = row.Offset(1)
  Wend
  [A1].Select
End Sub

Sub getMonthZoneRanks(month As Integer, year As Integer)
  If Not WhoAmIFilled() Then Exit Sub

  Dim ws As Worksheet, r As Long

  On Error Resume Next
  Set ws = Worksheets(year & " " & month)
  On Error GoTo 0
  If ws Is Nothing Then
    Call shMonth.Copy(After:=shOverall)
    Set ws = Worksheets("Month (2)")
    ws.Name = year & " " & month
    ws.Tab.Color = RGB(255, 0, 0)
  End If

  With ws
    .Activate
    GetWebData .Cells(2, 1), [maxMonthZones].Value, month, year
    For r = 3 To [maxMonthZones].Value * 1.1
      With .Cells(r, 4)
        If .Value <> "Points" Then .NumberFormatLocal = "###·###"
      End With
    Next
  End With
End Sub

Sub getZoneRanking(wsname As String, period As Integer)
  Dim URL As String
  Dim qt As QueryTable
  Dim ws As Worksheet
  Dim row As Range
  Dim c, r As Range

  URL = "http://e-e.com/shared/async/expertsZone/memberRank.jsp?etIndex=4&m_typeID=" & [StatsType] & "&m_periodID=" & period & "&hofStart=100000&m_subZoneID="
  ' All: typeID=0   Q's only: typeID=10    Articles: typeID=30

  On Error Resume Next
  If [ScratchArea].Name = "" Then [Setup!G1].Name = "ScratchArea"
  On Error GoTo 0

  If [ScratchArea].Count = 1 Then
    Range([ScratchArea].Address, [ScratchArea].Offset(10, 4).Address).Name = "ScratchArea"
  End If

  With Worksheets(wsname)
    .Activate
    Set row = [3:3]
    ' The 2 below is just a dummy Subzone (TA) ID, to make a valid URL
    Set qt = [ScratchArea].Parent.QueryTables.Add(Connection:="URL;" & URL & "2", Destination:=[ScratchArea])
    With qt
      .WebTables = 1    '[WebTables]                     '*** "11", sometimes "9"!
      .FillAdjacentFormulas = False
      .PreserveFormatting = True
      .AdjustColumnWidth = False
      .WebSelectionType = xlSpecifiedTables
      .WebFormatting = xlWebFormattingNone
      .WebPreFormattedTextToColumns = False
      .SaveData = False
      .BackgroundQuery = False
      .RefreshStyle = xlOverwriteCells
    End With

    While row.Cells(, 1) <> "" And row.row < [maxzones] * 1.1 + 2
      row.Cells(, [Ranks].Column).Select
      If row.Cells(, 5) <> "" Then
        Set c = [TopicIDs!B:B].Find(row.Cells(, 3), , xlValues, xlWhole, xlByRows, xlNext)
        qt.Connection = "URL;" & URL & c.Offset(0, -1).Value
        qt.Refresh
        row.Cells(, [Ranks].Column) = Replace([ScratchArea].Cells(2, 1), ",", "")
        ' Duplicate zone name, for ReSort...
        row.Cells(, [ZoneRK].Column) = row.Cells(, [Zone].Column)
      End If
      Set row = row.Offset(1)
    Wend
    qt.Delete
  End With

  [ScratchArea].ClearContents
  [A1].Select

End Sub
Almost all actions performed are based on Web Queries, issued by GetWebData. Web Queries call a Web page, then analyse the contents, and extract data structured as a table. You can play with that by going into the Data menu, Import External Data, New Web Query. Provide a valid Web link, and you will see what you can get. Or comment the line with qt.Delete in GetWebData, and start a month or overall read; then open context menu on cell C2, and "Edit Query". You should see the Web page used, with some yellow square symbols and a single green one for the member/zone ranking table. The URL you see determines the Web page, but the table reference is stored as a number in the query object (in .WebTables) and not directly visible to you.
The Web pages shown are not formatted using your country specific delimiters for numbers. Hence I had to change them or Excel won't be able to use the numbers because the comma is not always a valid thousands delimiter.
Since the Web Queries are doing nothing more than calling Web pages and extracting data from them, you can't get more than 10 zones per page. So we have to ask the Web pages repeatedly with a different starting page. Each query will again retrieve the column headers (Zone, Rank, Points), and we have to account for that. Because pretty printing matters, the code empties some of the cells, like removing the "No Certificates" rank, and hides the "superfluous" column titles.
As a last step, all internal linking is removed for the Web queries. Since we will not use the Refresh feature of those queries, the original linkage is useless, wasting storage memory.
GetMonthZoneRanks fills a single worksheet with zone ranking data of one month (month and year are provided as arguments). If the referenced worksheet does not exist, it will be created using the Month worksheet as template. New worksheets are inserted directly after the "Overall" worksheet, so the months will be ordered from right to left.
In most cases you will not need to call that procedure on your own, since there is getMonthZoneRanking. It will get the data for the current month. It applies a skew of two days back, as that works best; the stats are calculated only once a day, as you certainly know already. It is important to adjust this to what works best for your purpose - if the stats are getting into the wrong row in Ranking, this is why. (See the last chapter for details.)
GetMemberRanking has gotten quite long. I had to use some tricks to get the corresponding values, you can't retrieve them directly. That is what happens:
The Overall Member Ranking screen is called with your member name. As you know, you get a list of 10 members, and one of them is you. Normally, you are positioned at row 6, but that can change under rare circumstances (wouldn't work for the "toppest artists" like angelIII, for example). That is why I decided to use VLookup again to get the correct row. The values found are copied and the formulas removed - we are using the "ScratchArea" as a temporary database soon.
Now, we do the same with Yearly and Monthly Member Ranking.
After that, we can try to estimate the number of ranked experts in each period. Again, we cannot get that directly, as there is no table to read which contains that value. But if we retrieve the very last ranked member, let's say at rank 1 000 000, we will always get a single row, containing the last rank given.
Again, we perform this for Overall, Yearly and Monthly, and fix the values each time.
Now all we have to do is to find the corresponding cells in the Ranking worksheet. It helps we know each month builds a new row, the rest is simply math, and copying values from one cell to another via VBA code.
Hidden in the Ranking worksheet is another piece of "code", this time as Excel formula. Since the zone ranking columns there refer to worksheets named according to the value in column A (month and year), we have a lot of indirection. That is, the cell addresses we refer to are calculated - combined with the Lookup function, this allows for easy cut & paste without having to change anything in the cells. With the worksheets, you do not have any automation that relocates addresses with new worksheets, as it is done with cells on the same worksheet if you copy a formula in a cell. For example, = A3+B3 in cell C3 will be changed to = A4+B4 if copied to cell C4. But '2010 08'!A3 will only change to '2010 08'!A4.
Hence, the address is built with = Indirect("'" & year(A3) & " " & month(A3) & "'!A3"), and you can copy the formula to above or below. This so-called indirect addressing is used to build a cell address with other formulas resulting in a string, and refer to this dynamically addressed cell (or range).
However, indirect addressing implies that Excel refreshes and recalculates contents on each change of cells. Speed can decrease drastically if overused (just as a little warning for other projects). And the usage here makes it much more complex, as indirect addressing is combined with the Lookup function.
To avoid unnecessary recalculations on cell changes the VBA code switches calculations off while filling worksheets. That is always a good idea if you fill in much data by VBA code.
Some Thoughts
Be aware that there might be a difference between the data retrieved for current or past months if there is some point discussion or Moderator operation that results in removing and reassigning points. Usually this will only apply to the previous or current months, so if you find differences between the sum of your zone points and the total retrieved from the Web, you should adjust the last month (remember: you can't re-retrieve prior months anymore), until the result fits. The same applies to Member Ranking.
Note that with the recent changes to the point system there is no distinction in ranking between Article and Question points anymore. If you are active in Articles, it does make sense to use two separate workbooks, one for all points and another one for Articles only. And that is what the "Statistics Type" setting in Setup is for - it determines which one you want to see. Of course it does not make sense to change that often.
Compared to the previous release, the code has gone thru a complete reconditioning to account for the sheet variables and the site changes, and received some improvements. I have tried to remove all parts relying on a particular column layout, but there are still some.
One improvement is the replacement of references to existing worksheets via the Worksheets collection by variables. That requires that each worksheet gets a variable name. This is performed best in VBA Editor, in the properties of each sheet (press F4 for the property sheet), for the very first property called "(Name)". As soon as you enter something different here, you can use that name you entered directly as object reference. As an example see that I reference to the Overall sheet by using shOverall instead of Worksheets("Overall").
Important Changes Compared to First Release
If you have used the XLS version described in the preceding Article, you will just need to move or copy the monthly sheets into the new XLS. I recommend removing the formulas included before copying/moving, as they are no longer relevant, by calling the Formula2Value macro on the respective range. I have changed some of the formulas, including error checking, which makes them different too much from before to have an advantage from keeping them.
While you could also copy the Ranking sheet from the previous version, I advise to copy the rows manually and insert them in the existing one; then copy and insert the zone stat columns starting at column T.
Overall will be filled out completely again, so no need to take that one over.
Previously you used the RankDef sheet to set variables and start actions. That has now (more consistently) been moved into an own worksheet Setup.
EE Changes in the Ranking in July 2010
As already mentioned, the ranking system has been changed in several ways:
- Article and Question points can be retrieved separately or as overall points. Ranks are based on overall points only.
Previously you could get a Master in Articles or in Questions, but if you had 25000 in both, you have not been assigned a "degree". What you retrieve is determined by the "Statistics Type" setting in Setup worksheet, as already said.
- No historical data can be retrieved anymore. The only choices are (recent) year, month, week and day.
That means you have to get your stats for the last month in time - one or two days into the new month, else they are gone.
- Statistics are no longer calculated in (approximately) real-time, instead they are collected once a day at 0:00 GMT (for the previous day).
Both the "once a day" and "start at GMT" issues require us to have a more accurate time base, so we hit the right month no matter at which time and in which time zone we call for numbers. Below the "Statistics Type" you will find a time zone offset from GMT for exact that reason. Please be aware that it is still not accurate because of delays at EE. You should wait at least one hour after 0:00 GMT ;-).
The new retrieval of data is much faster now than before because of the way EE changed the calculation of statistics, which can be cached now. Thus the "Max zones" settings done in Setup worksheet are not that important anymore, and you can set them to 100 or more without any issues. With the exception of the "Zone Ranking" buttons: Since the number of ranks for each zone needs to be retrieved one by one, it does matter when you want to update those.
Please do not forget to press the "Thumbs up" button if this article was helpful.
Have a question about something in this article? You can receive help directly from the article author. Sign up for a free trial to get started.
Comments (33)
Commented:
No :( It is not working at all. I manually checked the link
URL = "https://www.experts-exchange.com/shared/async/expertsZone/memberRank.jsp?expertName=" & [WhoAmI] & "&m_typeID=" & [StatsType]
Which is working fine.
>>>Sid, since you are the Excel Genius here, you should be able to debug :P. Important is if the qt.refresh retrieves a table. Execute that line, and look into the corresponding area on the sheet.
You have set me thinking :-D
I am building it from scratch. Here is what I have made so far
Snapshot 1 is when you open the file and Snapshot 2 is after you login. Completing it will take sometime though.
My only worry is EE doesn't object about the Image that I have used in the login screen over copyright issues as I am making it for EE...
Mods: If you feel that I shouldn't use the image then please do let me know and I will remove it.
Sid
1.bmp
2.bmp
Author
Commented:Author
Commented:Commented:
Any help appreciated. I am in the process of looking for a new position and this may help me stand out from the crowd.
Thanks !
Author
Commented:https://www.experts-exchange.com/memberSearchResults.jsp?sort=110_-1&searchDisplayTypeID=1&ListNamesort=-1&ListNameorderBy=110&ListNamelistView=1&epp=200
to get a list of 200 Experts, descending on #certifications.
You can't put that into Excel easily, or if you do, data starts at row 124 (header in row 123). That is because the results are no web tables.
What do you want to do with the list?
View More