Server hangs exactly at noon with eventlog 6013
Each day my file server hangs for a few minutes exactly at noon. I have no idea what is going on to cause this and it happens even on weekends when I am the only one logged in to the server. The only thing that gets reported in the event log is this:
Event Type: Information
Event Source: EventLog
Event Category: None
Event ID: 6013
Date: 2/22/2010
Time: 12:00:00 PM
User: N/A
Computer: POS-FILE
Description:
The system uptime is 662425 seconds.
Could simply reporting the system uptime cause the sytem to hang for a few minutes? Can I change the system uptime reporting to do this at midnight instead of noon?
Thanks for any help/suggestions.
ASKER CERTIFIED SOLUTION
membership
This solution is only available to members.
To access this solution, you must be a member of Experts Exchange.
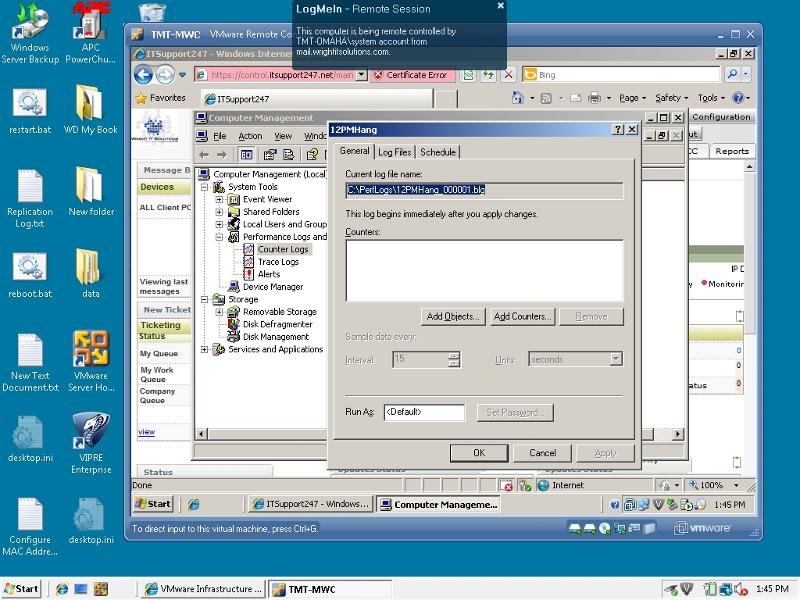
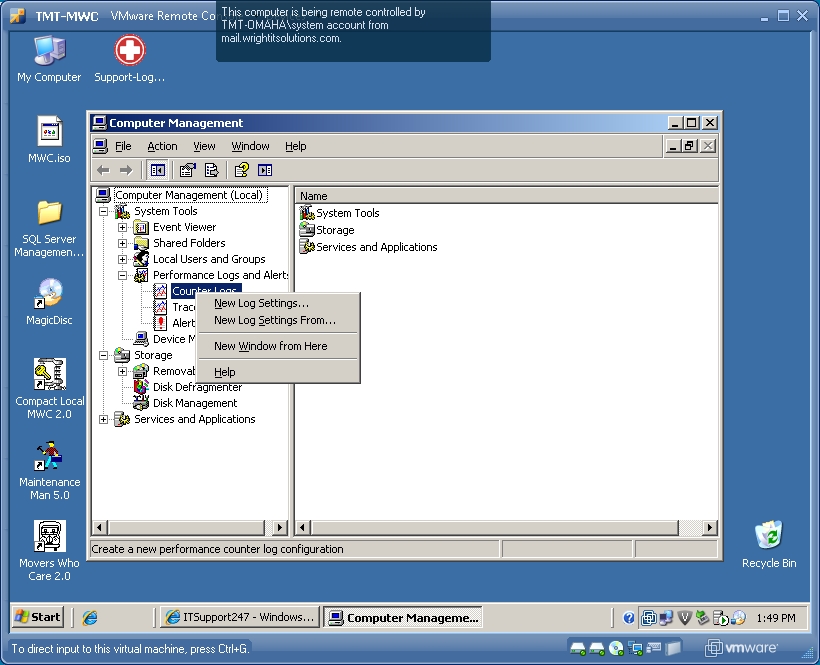
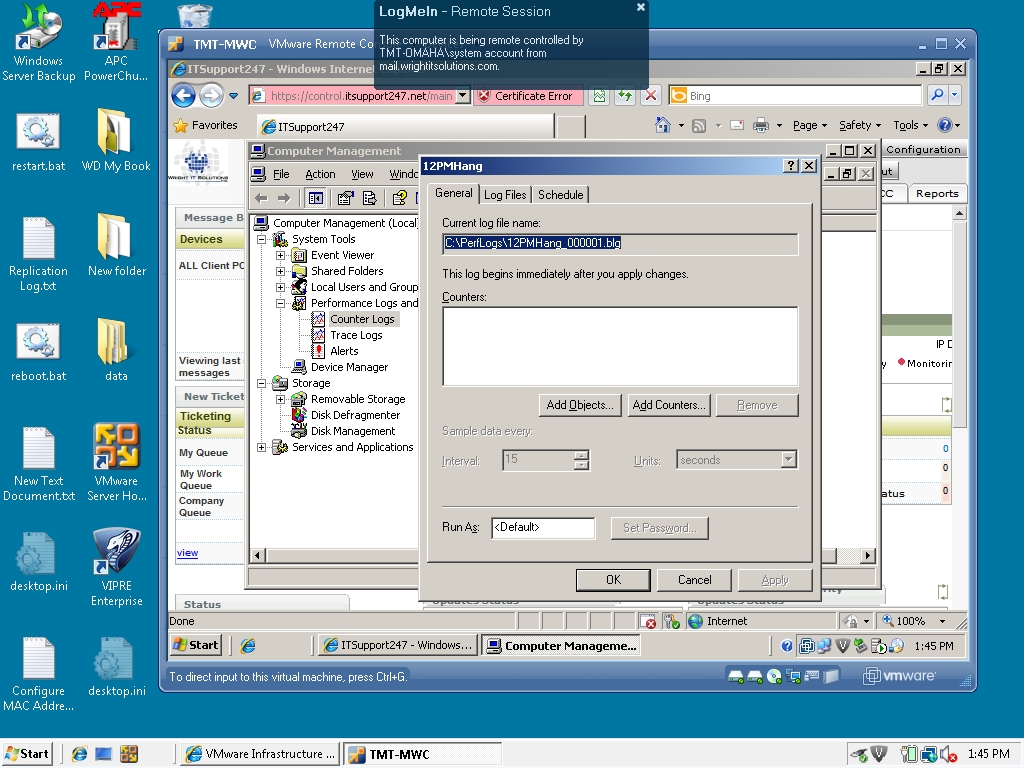
Well, the easier answer is to set up a new counter. Start... Run... Perfmon... Expand Performance Logs and Alerts. Right-Click counter logs, select New Log Settings.... Give it a name. Click Add Counters. Select the counters you want to add. Once you add your counters, click Apply. It will prompt you to create the Log. It will be running. You can then either 1) Stop it and run it right before your server hangs (maybe start it at 11:00:00) or 2) let it run until the next system shut down.
Justin
Justin
ASKER
I just set it to start loggin. I will see what happens at noon. Thanks.
ASKER
I have to log what do i do with it? Thanks.
Kim,
First, check the counters and see if you notice any spikes just before the server hung (assuming it did today). Do you see anything like a spike in CPU usage, memory, or a drop in free space on the logical disk?
Justin
First, check the counters and see if you notice any spikes just before the server hung (assuming it did today). Do you see anything like a spike in CPU usage, memory, or a drop in free space on the logical disk?
Justin
ASKER
Not only do I have spikes in pages/sec the average disk queue length is right at the top of the page for the entire slow down. When I look at task mager and see what is using the I/O I see:
SNMP.exe using over 17,000,000 I/O reads
system over 53,000,000 I/O other
services over 20,000,000 I/O writes
I still dont understand what is causing the slow down. I created a log but I dont know how to read it.
SNMP.exe using over 17,000,000 I/O reads
system over 53,000,000 I/O other
services over 20,000,000 I/O writes
I still dont understand what is causing the slow down. I created a log but I dont know how to read it.
ASKER
Here is an image that might help.
pos-file.bmp
pos-file.bmp
Kim,
Did you get this resolved, or are you still needing assistance?
Justin
Did you get this resolved, or are you still needing assistance?
Justin
ASKER
I still need help. Any suggestions would be appreciated. Thanks.
Let's capture some other information instead of what you are grabbing:
Justin
- Memory - % Committed Bytes in Use
- Memory - Availible MBytes
- Memory - Pool Nonpaged Bytes
- PhysicalDisk - Disk Reads/sec
- PhysicalDisk - Disk Writes/sec
- Processor - % Idle Time
Justin
ASKER
ok so I've replaced the standard ones with those, what next? Thanks.
Try to capture what happens right before your reboot... :)
ASKER
So I have been tracking the logs, what should I do now, I don't know how to read them. It looks like:
Memory - % Committed Bytes in Use = Almost always right around 50%
Memory - Availible MBytes = I dont see this on the graph
Memory - Pool Nonpaged Bytes = I dont see this on the graph
PhysicalDisk - Disk Reads/sec = Almost like a heart beat going from 0-50 fairly regularly
PhysicalDisk - Disk Writes/sec = Almost like a heart beat going from 0-50 fairly regularly
Processor - % Idle Time = Between 80-100%
What roles does this server perform? What applications are running on it? It doesn't appear to be a Windows caused error, so let's look at the other things going on.
ASKER
This server is a file server, it hosts all the files and printers. The only thing it runs is Vipre Enterprise Administrative console for our anti-virus monitoring.
SOLUTION
membership
This solution is only available to members.
To access this solution, you must be a member of Experts Exchange.
ASKER
I feel like an idiot, it turns out that at exactly noon everyone is running a virus scan and the server is checking for updates.
ASKER
Thanks.
Hello Experts. I've got the same issue, as this thread. Just started this week. We too use Vipre Enterprise. Can you please help me setup the counters. Please provide laymans level instructions. I can get to the performance counters, then I get lost. What do I do next? Thanks! 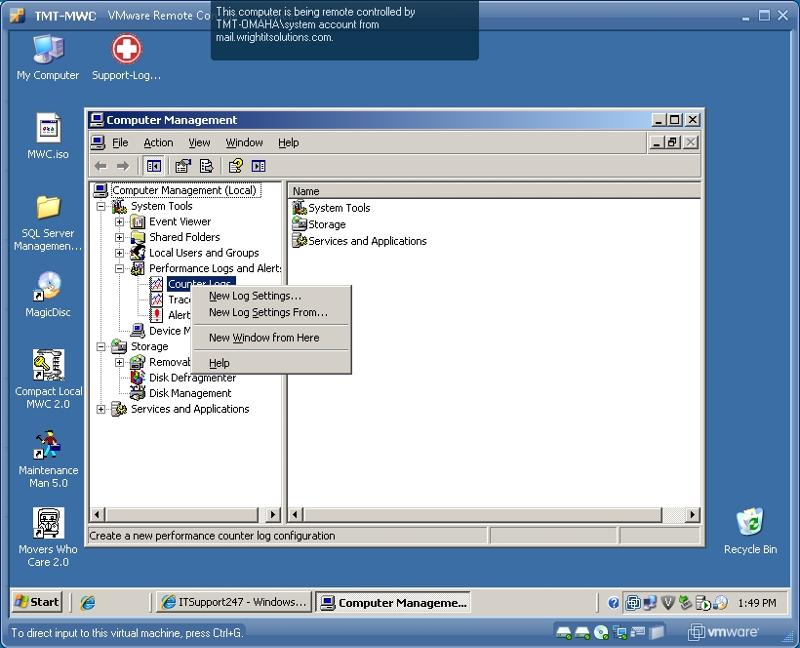
ASKER
Thanks.