Mystical_Ice
asked on
How to check which device is using bandwidth on Cisco ASA??
We have several dozen servers behind a Cisco ASA 5505. Something is eating up all our bandwidth, and I'm trying to figure out what it is. How would I do that on the ASA? There's got to be a way
Do you have asdm and if so what version?
ASKER CERTIFIED SOLUTION
membership
This solution is only available to members.
To access this solution, you must be a member of Experts Exchange.
SOLUTION
membership
This solution is only available to members.
To access this solution, you must be a member of Experts Exchange.
ASKER
Not sure on asdm offhand, but the ASA is running version 8.2, i know that.
Thanks for the other suggestions - i'm going to try these as soon as i get back from lunch
Thanks for the other suggestions - i'm going to try these as soon as i get back from lunch
SOLUTION
membership
This solution is only available to members.
To access this solution, you must be a member of Experts Exchange.
PRTG has come a long way since this question was first opened!
There are different methods available to see who or what is hogging your bandwidth, but the two most common are SNMP and flow:
1. SNMP (Simple Network Management Protocol) provides traffic counters so you can collect statistics about the amount of traffic you have on a connection, over time, to see if you have enough capacity. SNMP is an industry standard that’s supported by pretty much every vendor. SNMP shows you the amount of traffic in/out, the number of broadcasts, multicasts, errors or discards you have on each port.
SNMP is supported by every major network vendor and every major operating system, so you’re not limited to switches here – you can use SNMP to collect stats not only from switches, but also from servers, virtual servers, storage systems, and workstations.
PRTG Network Monitor includes SNMP traffic sensors out-of-the box, so all you need to do is enter your SNMP credentials into PRTG and it will start monitoring your traffic for you.
2. The flow protocols include NetFlow (Cisco, VMware), jFLow (Juniper), sFlow (HP) and IPFIX (Cisco, VMware). The results from all of these are similar, and they show you not only how much traffic you have, but what machines and what protocols are using the most bandwidth. So, you can see if one specific user or a certain application is using more than their fair share.
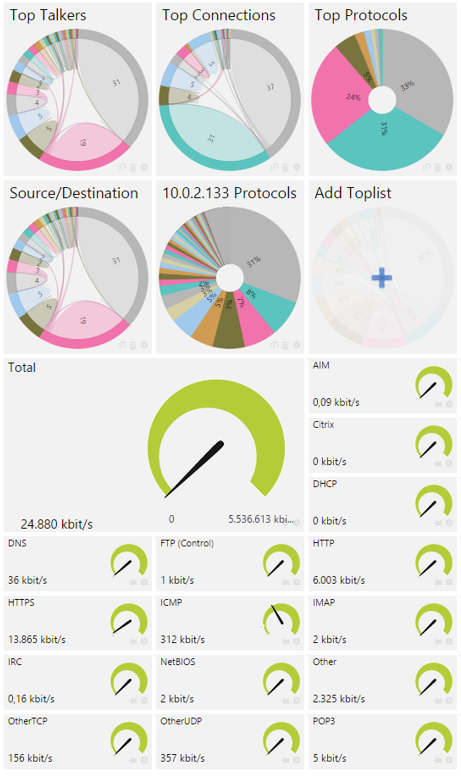
The switches collect data about all of the traffic flows passing through that switch, and then send summarized information about these flows to a flow “receiver”. PRTG includes receivers for NetFlow v5, NetFlow v9, jFlow, sFlow and IPFIX, so you only need to enable flow on your switches and configure your PRTG server as the recipient of the flows. PRTG will then analyze the incoming flow data and will show you the top talkers, top protocols, and top connections.
To see the PRTG bandwidth sensors in action, check out our video tutorials:
• Bandwidth Monitoring with SNMP and WMI
• Bandwidth Monitoring with NetFlow and Packet Sniffing
If you'd like to give PRTG a try, download our free 30-day trial version with unlimited sensors ([Video] What is a Sensor?). After the 30 days it will automatically revert to our 100-sensor freeware version.
To give you an idea of what PRTG looks like, here's a screenshot from a netflow sensor:
There are different methods available to see who or what is hogging your bandwidth, but the two most common are SNMP and flow:
1. SNMP (Simple Network Management Protocol) provides traffic counters so you can collect statistics about the amount of traffic you have on a connection, over time, to see if you have enough capacity. SNMP is an industry standard that’s supported by pretty much every vendor. SNMP shows you the amount of traffic in/out, the number of broadcasts, multicasts, errors or discards you have on each port.
SNMP is supported by every major network vendor and every major operating system, so you’re not limited to switches here – you can use SNMP to collect stats not only from switches, but also from servers, virtual servers, storage systems, and workstations.
PRTG Network Monitor includes SNMP traffic sensors out-of-the box, so all you need to do is enter your SNMP credentials into PRTG and it will start monitoring your traffic for you.
2. The flow protocols include NetFlow (Cisco, VMware), jFLow (Juniper), sFlow (HP) and IPFIX (Cisco, VMware). The results from all of these are similar, and they show you not only how much traffic you have, but what machines and what protocols are using the most bandwidth. So, you can see if one specific user or a certain application is using more than their fair share.
The switches collect data about all of the traffic flows passing through that switch, and then send summarized information about these flows to a flow “receiver”. PRTG includes receivers for NetFlow v5, NetFlow v9, jFlow, sFlow and IPFIX, so you only need to enable flow on your switches and configure your PRTG server as the recipient of the flows. PRTG will then analyze the incoming flow data and will show you the top talkers, top protocols, and top connections.
To see the PRTG bandwidth sensors in action, check out our video tutorials:
• Bandwidth Monitoring with SNMP and WMI
• Bandwidth Monitoring with NetFlow and Packet Sniffing
If you'd like to give PRTG a try, download our free 30-day trial version with unlimited sensors ([Video] What is a Sensor?). After the 30 days it will automatically revert to our 100-sensor freeware version.
To give you an idea of what PRTG looks like, here's a screenshot from a netflow sensor: