giovaniluigi
asked on
GDI+ Graphics Path - How to fill a path with ARGB ?
Hi,
I'm using Visual Studio 2008 with GDI+ to develop a simple app.
(Code in VB.NET)
I'm using this simple code to fill a path created with points.
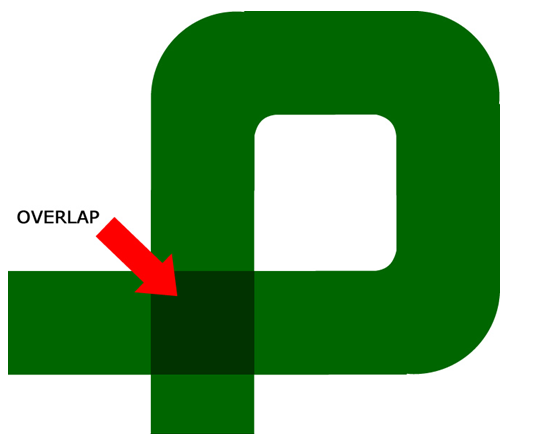
I want that when the path intersect itself it becomes darker.
In order to do this, I used ARGB but GDI+ consider that the path is a unique object, so the overlap never happens.
Someone have any idea in how to solve this problem ?
I want to create an effect like the attached picture:
I'm using Visual Studio 2008 with GDI+ to develop a simple app.
(Code in VB.NET)
I'm using this simple code to fill a path created with points.
Dim caneta As New Pen(Color.FromArgb(127, 0, 100, 10), 40)
path.FillMode = Drawing2D.FillMode.Winding
e.Graphics.DrawPath(caneta, path)I want that when the path intersect itself it becomes darker.
In order to do this, I used ARGB but GDI+ consider that the path is a unique object, so the overlap never happens.
Someone have any idea in how to solve this problem ?
I want to create an effect like the attached picture:
SOLUTION
membership
This solution is only available to members.
To access this solution, you must be a member of Experts Exchange.
Paint does exactly what I have described as unpracticable to implement in GDI+, say, by picking each pixel color value and by computating the new color and by poking suck new color in the pixel. Paint has it implemented in low level (Assembly) programming, with good performance.
By the other hand, GDI is very slow for pixel operations, so we shouldn't adopt this approach in an application. This is why I have suggested to draw polygons, which are supported by GDI with acceptable performance.
Let me understand your application. Is is an interactive one, say, an user draws in the same way as he uses Paint? Or your application draws areas programmaticatly (no human intervention)? In other words, does your application calculate where to draw or is it determined by an user?
In the first case (interactive application) we must call pixel functions, in the second case (automatic application) we can chose to call pixel or area painting. Anyway, pixel operations (GetPixel, SetPixel) will be V E R Y S L O W, so you can try tLockBit functions.
My first suggestion is to see at http://www.bobpowell.net/lockingbits.htm if the directions there are applicable to your needs. Probably yes.
Jose
Are you looking to define the path, or have you done that already? I can see a way to simulate, with a series of arcs and rectangles, but that is only a thought experiment for now...
ASKER
The path is drawn by coordinates received from a GPS in real time.
It's a kind of track logging.
When the GPS moves, the program draw the path, where you passed by.
Due the GPS coordinates, the image have a huge size.
The picture goes from -500.000.000 to +500.000.000 in x and y axis.
I used polygons to draw the path.
Having a line of points, I can draw polygons following the line, to simulate the Path width.
But with simple polygons the image becomes with poor quality.
When I have a curve for example the deformation appears.
With some math I reduced the deformation but the performance downs.
The quantity of polygons and the math used turns the performance very low for a real time program.
For example I will need to redraw about 10.000 polygons every time I need to rotate the image that will be needed for my application.
Depending of the time that the user active the GPS, the number os polygons can increase to 50.000 or more.
So I need to figure out how to use a unique Path to get a better performance and a smooth result specially in curves.
The only problem is that with Path I can't show to the user the overlapped area.
Take a look on the result using polygons to generate the Path:
giovaniluigi-410980.flv
To clarify the problem, your drawing a line along the path with a wide pen, is that correct?
For this to work you need to divide the path into sections, so that overlapping parts of the path are drawn with different calls to DrawPath.
Some questions that might help solve the problem -
What language are you using?
Are all 10,000 polygons actually visible to the user all the time?
How are you optimising the polygons?
ASKER
I'm using VB.NET
The 10.000 polygons are visible most of the time, when user use "zoom in" the number reduces of course.
But the video that I attached was made with my app, drawing some polygons with the algorithm that I created to simulate the path with wide pen.
On the video I drew with mouse, so the count of polygons was low. But in the real application, each second the program add 5 new points, wich means 5 new polygons.
The app will run for 3 hours for example.
Having 5 new polygons each second, we will have 54.000 polygons after tree hours.
All this will be visible using transformation to scale the image to fit monitor.
That is why I need to use Path instead polygons.
To divide the path into sections I will need to define the size of a section.
If I understood your idea, it is something like that:
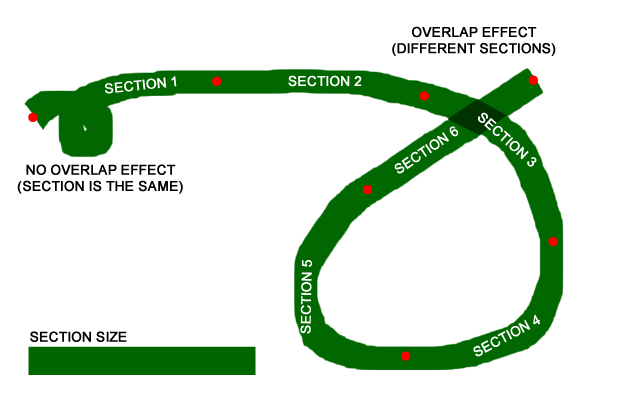
If this size is too high the overlap effect will not happen.
If the size of each section is too low, the performance will be low as the polygons solution.
The 10.000 polygons are visible most of the time, when user use "zoom in" the number reduces of course.
But the video that I attached was made with my app, drawing some polygons with the algorithm that I created to simulate the path with wide pen.
On the video I drew with mouse, so the count of polygons was low. But in the real application, each second the program add 5 new points, wich means 5 new polygons.
The app will run for 3 hours for example.
Having 5 new polygons each second, we will have 54.000 polygons after tree hours.
All this will be visible using transformation to scale the image to fit monitor.
That is why I need to use Path instead polygons.
To divide the path into sections I will need to define the size of a section.
If I understood your idea, it is something like that:
If this size is too high the overlap effect will not happen.
If the size of each section is too low, the performance will be low as the polygons solution.
SOLUTION
membership
This solution is only available to members.
To access this solution, you must be a member of Experts Exchange.
Did a diagram to help explain the dividing sections by directions idea. Hopefully pictures are easier to understand.
expert.gif
expert.gif
ASKER
Thank you satsumo
Your idea is very good about dividing when I have significative change of direction.
Another thing to do, is to simplify the data that describes the path.
For example I can have a straight line represented by 100 point when 2 points is enough because it's a straight line!
The question is, there is some kind of Math trick to do a simplification based on the behavior of the data ? I mean, there is something opposite to interpolation ?
In interpolation I have few points and I get a curve based on the behavior of these points.
I want to do the opposite. Having a lot of points, I want to extract the most important points.
The problem that I see here is how to analyse the behavior of data and decide when a point is relevant.
I thought in using derivative calculus but if there is a better way to go I prefer than using derivative.
ASKER CERTIFIED SOLUTION
membership
This solution is only available to members.
To access this solution, you must be a member of Experts Exchange.
No need for calculus, the simple way to get the angle and weight is a little bit of trigonometry. Lets say we have 3 points a, b and c, each has an x and y coordinate. Distance from a to b is this -
The last two lines calulate the normal from a to b (so I called it nab). If the code has two normals, from a to b and from b to c, the sine and cosine of the angle between them is -
d.x = b.x - a.x
d.y = b.y - a.y
distance = sqrt (d.x * d.x + d.y * d.y)
nab.x = d.x / distance;
nab.y = d.y / distance;The last two lines calulate the normal from a to b (so I called it nab). If the code has two normals, from a to b and from b to c, the sine and cosine of the angle between them is -
sine = (nab.y * nbc.x) + (-nab.x * nbc.y)
cosine =  (nab.x * nbc.x) + (nab.y * nbc.y)
ASKER
I just didn't understood how to implement in my code.
Take a look on MS Paint: (Windows 7)
giovaniluigi-408673.flv
GDI+ doesn't offer a simple way to do this ? If no, there is another library to facilitate this type of 2D drawing on .NET Visual Studio ?