allelopath
asked on
JFreeChart: Fill in XYPlot
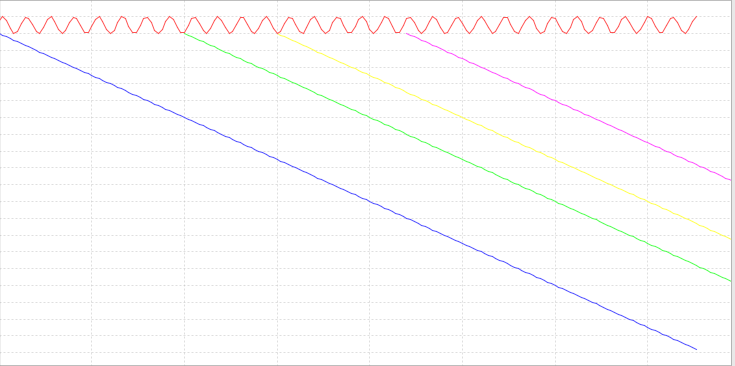
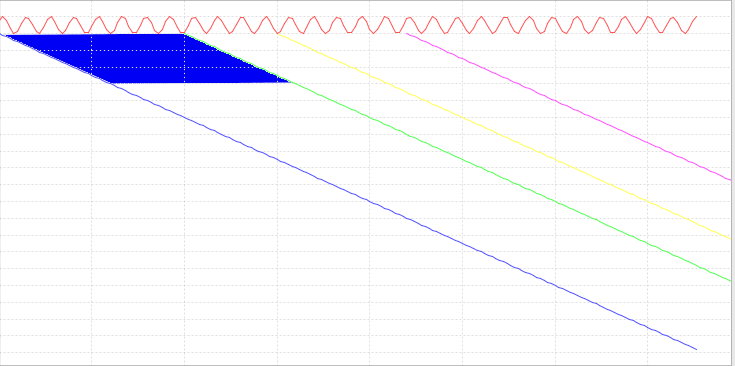
Two images, first is what I have, second is what I want.
This is an XYPlot with 5 XYSeries (a sine function and 4 lines).
How do I fill in an area as shown in the second image.
Assume I know the 4 (x,y) coordinates defining the parallelogram.
This is an XYPlot with 5 XYSeries (a sine function and 4 lines).
How do I fill in an area as shown in the second image.
Assume I know the 4 (x,y) coordinates defining the parallelogram.
mrcoffee365
I believe that this sort of thing is done with overlaying 2 plots. The second one would only have the fill in the section you want.
ASKER CERTIFIED SOLUTION
membership
This solution is only available to members.
To access this solution, you must be a member of Experts Exchange.
ASKER
Thinking about this more. What I would ultimately like is as below. Basically, its an area bounded by functions. One function is the sine wave, Two are the diagonal lines and the last is just the bottom of the chart. I could create a horizontal line function to bound the bottom. So the question really is:
How do I fill in an area whose boundary is defined by a set of functions?
chart-fill.png
How do I fill in an area whose boundary is defined by a set of functions?
chart-fill.png
With Graphics2D you still can do it even if you will want to create
a sufficient number of points on the sine part of the path to make sure it looks nice.
Can you do it with JFreeChart?
a sufficient number of points on the sine part of the path to make sure it looks nice.
Can you do it with JFreeChart?
SOLUTION
membership
This solution is only available to members.
To access this solution, you must be a member of Experts Exchange.
ASKER
I haven't had time to work on this. I will close the question and post again if need be.