jaustinr
asked on
Pivot Tables - Calculated Value
I have a Pivot table that has a variable (set to Count) that has columns over a 10 year period. The last year/period represents only a potion of the year so I would like to "annualize" the last year/period data. I want to do this by dividing the last years count value by the ratio of days currently represented in the year to date (e.g., .141 for date in February). I've looked at calculated variables but it does not appear that you can work with a count value and modify it as I've described. I reuse the same pivot table for different data sets that (using VBA) that prohibits me from putting the pivot table value in a normal Excel cell and doing the calculations. I pull the values directly from the pivot table to a data select on an Excel chart.
ASKER
I will look at how I might display the PT. The underlying data is really not an issue and should have no impact on the solution. I simply have a variable in the PT that I've set to Count. The PT summarizes the number of rows associated with that variable as a number (count). I have a count for each of the 10 years of data I'm analyzing. Since I don't have a full year for 2011 I want to correct the 2011 count by dividing by a correction factor. As I noted, I cannot pull the 2011 count to a cell and do the calculations as the overall automated analysis procedure requires I pull the data directly to an Excel chart process. The exact PT path for each chart value is inserted into the "select data" function of the Excel chart. I need to find a way to correct one of the values before plotting. I've tried to add calculations into the select data area but it isn't compatible with this type function. I've also looked at using a calculated value but don't see a way to use a count (of a variable) in the calculation.
jaustinr
jaustinr
I understand, but it would be a simple think for you to create a simple problem I can help you to solve, as opposed to me straining my brain to simulate that. I'm willing to help you solve the problem - are you willing to create a sample dataset so I can help you solve the problem?
Dave
Dave
SOLUTION
membership
This solution is only available to members.
To access this solution, you must be a member of Experts Exchange.
If this is the not direction you're going, or you want something more precisely like what you're trying to do, then please provide SAMPLE DATA to help with clarification.
Thanks for your indulgence as it will help speed responses and solutions!
dave
Thanks for your indulgence as it will help speed responses and solutions!
dave
If the solution doesn't suffice and you need help generating sample data or example - you could provide a print screen of your pivot table or even double click one of the value fields to generate a simple 1-row table that could be useful in assisting you further.
Cheers,
Dave
Cheers,
Dave
ASKER
Dave,
I guess I should have used all 500 words (or a lot less) to describe my problem. :) I really appreciate your taking the time to look at my issue. You are exactly on the path of what I'm trying to do. In your example, I have the year fraction. Since I do an update 1-2x/month, so this is not an issue. However, my "salary" variable is actually a "count" of salaries. So, my real problem is how to do additional calculations (within PT) on the count. At this point, my only solution may be to create the annualized data point back in Access where my original dataset resides. However, not sure how that would interact with my PT and it makes the process a lot more complex.
Thanks again and any additional thoughts appreciated.
John
Just give me a few rows of made-up data, or a made-up snapshot of your pivot, and I can help, further.
Ok - willing to try this once more, without data - which would be really refreshing. Many times we can give you exactly what you asked for, and yet that's not what you're LOOKING for. A PICTURE is worth 1000 words and sometimes 1000 words don't get it :)
Here it goes. I assume there's two people, with fraction thru the year called Annualized Fraction (which you say you have) and have received # of paychecks (no ryme or reason, that's just how many times they got paid).
So the # paychecks is your COUNT of salaries, for example purposes.
Then...
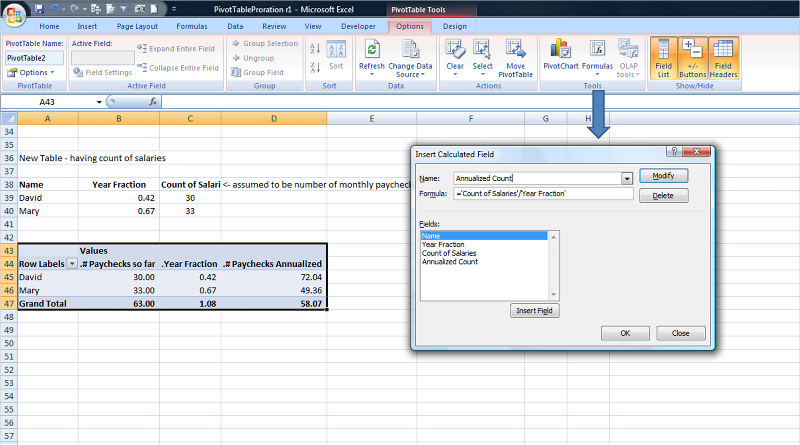
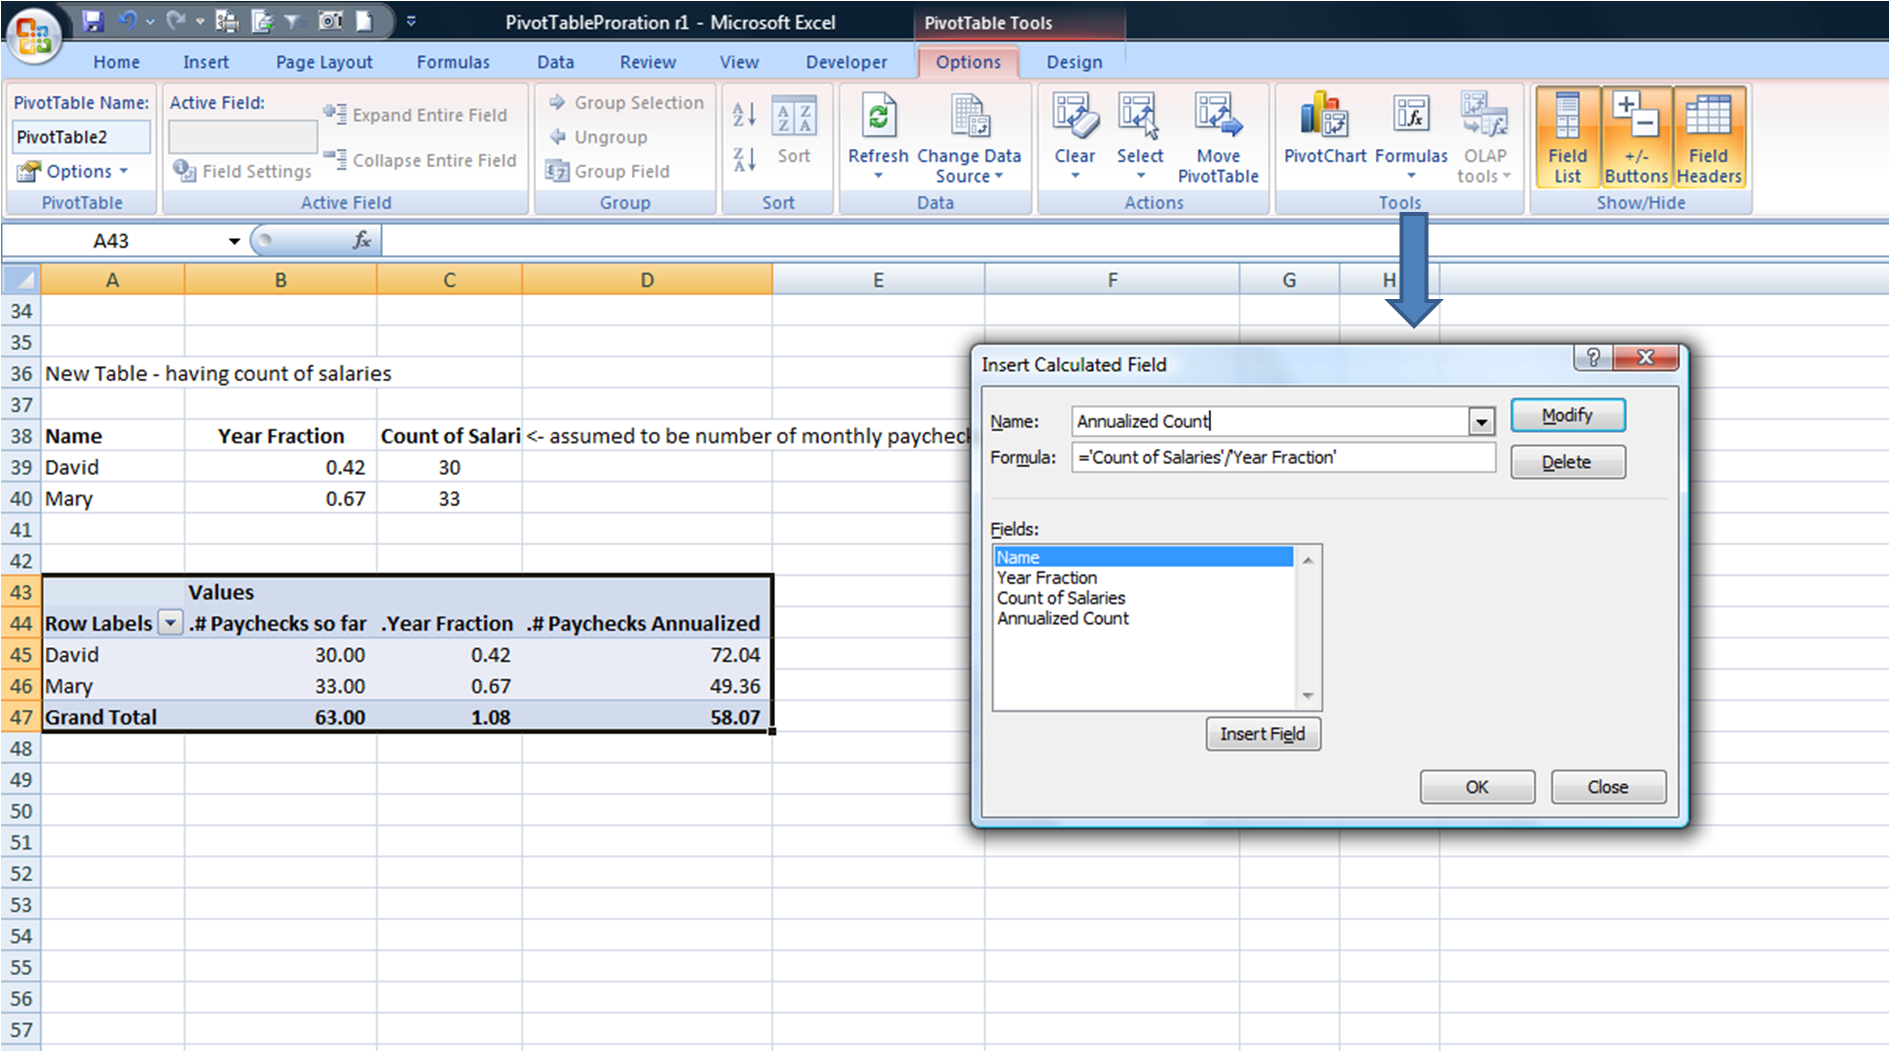
Annualized # paychecks (annualized count) = # Paychecks / Annualized Fraction.
If I'm off here, I'd like you to at least show an example to me just like how I'm explaining to you.
So if Mary has had 12 paychecks and her annualizing fraction = .5, the Annualized # Paychecks would be 24.
Here's the example, see attached range 36-48 of the data and pivot table. I clicked in the data, then selected Pivot Table tools, then Formulas, and added a Calculated Field, called Annualized Count, with the formula above, see picture.
 Also, see attached.
Enjoy!
Dave
PivotTableProration-r2.xlsx
Here it goes. I assume there's two people, with fraction thru the year called Annualized Fraction (which you say you have) and have received # of paychecks (no ryme or reason, that's just how many times they got paid).
So the # paychecks is your COUNT of salaries, for example purposes.
Then...
Annualized # paychecks (annualized count) = # Paychecks / Annualized Fraction.
If I'm off here, I'd like you to at least show an example to me just like how I'm explaining to you.
So if Mary has had 12 paychecks and her annualizing fraction = .5, the Annualized # Paychecks would be 24.
Here's the example, see attached range 36-48 of the data and pivot table. I clicked in the data, then selected Pivot Table tools, then Formulas, and added a Calculated Field, called Annualized Count, with the formula above, see picture.
 Also, see attached.
Enjoy!
Dave
PivotTableProration-r2.xlsx
ASKER
Dave,
Your most recent approach looks very promising. I have to be out of town for a couple of days, but will definately try it when I return
Thanks for continuing to pursue
John
Your most recent approach looks very promising. I have to be out of town for a couple of days, but will definately try it when I return
Thanks for continuing to pursue
John
How's it going? Is this working for you?
dave
dave
ASKER
Dave,
Just returned from travel and had a couple of things get in the way. Plan on trying today or tomorrow. Will let you know my results.
Thanks,
John
Just returned from travel and had a couple of things get in the way. Plan on trying today or tomorrow. Will let you know my results.
Thanks,
John
ASKER CERTIFIED SOLUTION
membership
This solution is only available to members.
To access this solution, you must be a member of Experts Exchange.
I am willing to pursue this only if you provide sample dataset representing what you're working with.
Cheers,
Dave
Cheers,
Dave
ASKER
Solution was found by expert guiding me through the logic process and I was able to find a direct solution.
Dave