Date Graph
I have an excel spreadsheet continaing a data range (attached).
I am using Excel 2010.
I would like to create a graph from the data, so that I have a year in months along the bottom, with the specific events plotted on the graph, according to the date. I have attached a mock up. I dont seem to be able to do a whole year and have the events spanning their dates. data-range.xlsx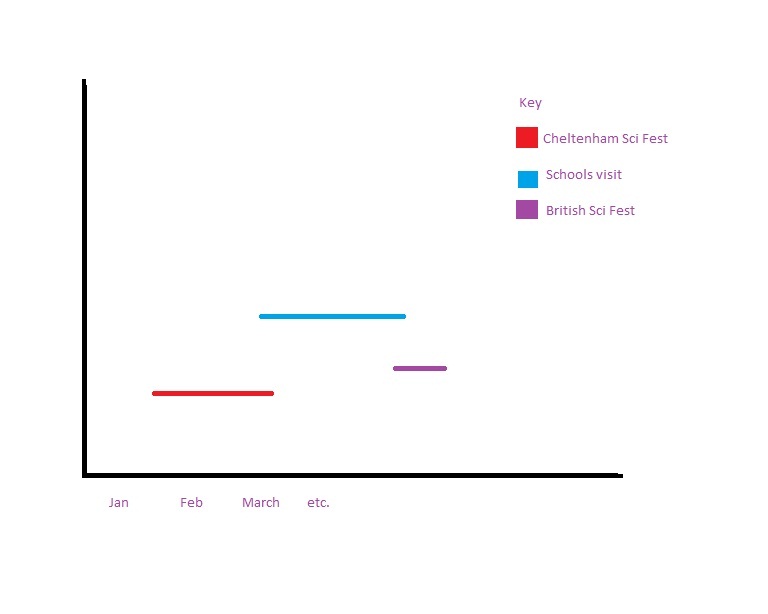
ASKER CERTIFIED SOLUTION
membership
This solution is only available to members.
To access this solution, you must be a member of Experts Exchange.
In simple terms you need to create a stacked graph but there is a series before the individual entries which is "invisible" (white box with white borders on white background). In this case the value of the invisible box would be the number of days from the start of the year to the start of the event. The size of the box is the number of days of the event.
Regards
Rob H