allelopath
asked on
Excel: quadratic equation
Does excel have a quadratic equation function?
I have a set of points that I would like to fit ax^2+bx+c=0 though.
I have a set of points that I would like to fit ax^2+bx+c=0 though.
How many points do you have? You need three points to determine a parabola.
If you have more than three points, you can use linear regression in Excel to solve for A, B, and C.
You have to set your data up in a table.
For each data point: x² is the coefficient of A x is the coefficient of B 1 is the coefficient of C
If you have more than three points, you can use linear regression in Excel to solve for A, B, and C.
You have to set your data up in a table.
For each data point: x² is the coefficient of A x is the coefficient of B 1 is the coefficient of C
ASKER
In this case, 105 points
ASKER
like so
points.xls
points.xls
You have have a 105 values. What do they mean? What is x?
Why do you think this data should be fit to a quadratic?
These values are measurements of ????? varying with respect to ?????.
Why do you think this data should be fit to a quadratic?
These values are measurements of ????? varying with respect to ?????.
ASKER CERTIFIED SOLUTION
membership
This solution is only available to members.
To access this solution, you must be a member of Experts Exchange.
ASKER
d-glitch:
my apologies, the file I attached had only the y values. The x values should have been 0 - 105.
byundt, however, went the extra mile and figured it out.
my apologies, the file I attached had only the y values. The x values should have been 0 - 105.
byundt, however, went the extra mile and figured it out.
If x values are 0 to 105, then the R squared will be the same, but the coefficients will be slightly different:
y = -0.000514x2 + 0.047529x - 0.609489
R² = 0.695230
Brad
y = -0.000514x2 + 0.047529x - 0.609489
R² = 0.695230
Brad
Doing a rough fit by eye:

     Doing a rough fit by eye:

          -(60 - X)²                -X²      3X
    Y  =  ----------  +  0.5    =   ---  +  ----  -  8.5
            400                     400      10
I seriously doubt that a quadratic is a good fit for your data. Should the data really start dropping rapidly with no lower bound as x gets higher?
Here's a graph showing what the data of a best-fit quadratic would go compared to your data.
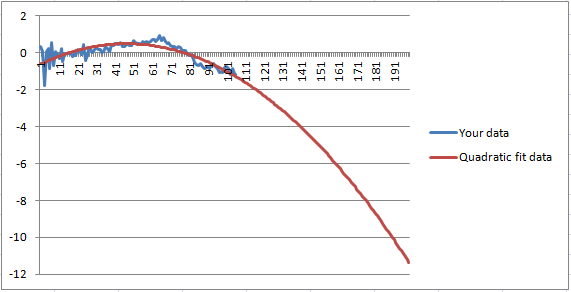
Needs some work, but it's a start.
ExEx-Quadratic.pdf
ExEx-Quadratic.pdf
TommySzalapski is way ahead here....
I assumed byundt did a proper best-fit method to get his function and just used it. The point is that I am unsure that a quadratic is the right choice as d-glitch mentioned earlier. I repeat his questions here:
"These values are measurements of ????? varying with respect to ?????."
"These values are measurements of ????? varying with respect to ?????."
ASKER
TommySzalapski:
You have no way of knowing this, but project the data beyond 106 doesn't make sense.
The quadratic fits well enough to suit my purposes.
You have no way of knowing this, but project the data beyond 106 doesn't make sense.
The quadratic fits well enough to suit my purposes.
http://www.bettersolutions.com/excel/EAV113/LT721811311.htm