dbrennecke
asked on
SSRS 2008 Line chart help
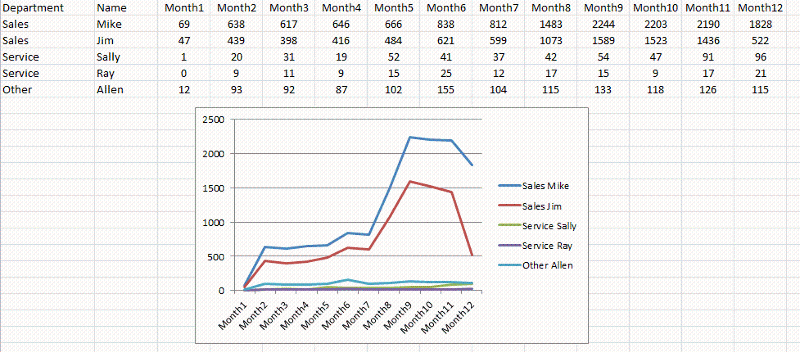
This seems like a very simple report that I am trying to deploy. It is essentially a rolling 12-month sales report across departments and users. I have attached a screenshot from excel showing what I am trying to accomplish. My sql query returns the table data shown in the grid. I just can't figure out how to display it as a line chart in SSRS. (One click via Excel, so I have to assume this is something I am just missing).
Thanks!
Thanks!

ASKER
The 2005 tutorial doesn't seem to help me out with the 2008 environment. I was familiar with 2005, but not 2008.. and I can't seem to figure this out.
ASKER CERTIFIED SOLUTION
membership
This solution is only available to members.
To access this solution, you must be a member of Experts Exchange.
This question has been classified as abandoned and is closed as part of the Cleanup Program. See the recommendation for more details.
http://www.simple-talk.com/sql/reporting-services/beginning-sql-server-2005-reporting-services-part-3-the-chart-control/