jamessward
asked on
Resource Monitor shows 4GB total "In Use" memory, but processes only account for 1GB
We have a production web server running Windows Server 2008 x64 with 8GB of RAM. After it was placed into production the app team noticed that "In Use" memory as identified by Windows Resource Monitor (and RAMMap) has been growing over time, despite the server not being under increased load. "In Use" memory even increases during non-business hours when the server isn't in use at all. Currently "In Use" memory totals approximately 4GB. However, if I look at the Memory tab of Resource Monitor and total up the Working Set of each process they're only using about 1GB total. We want to identify the source of the memory consumption growth so it can be fixed.
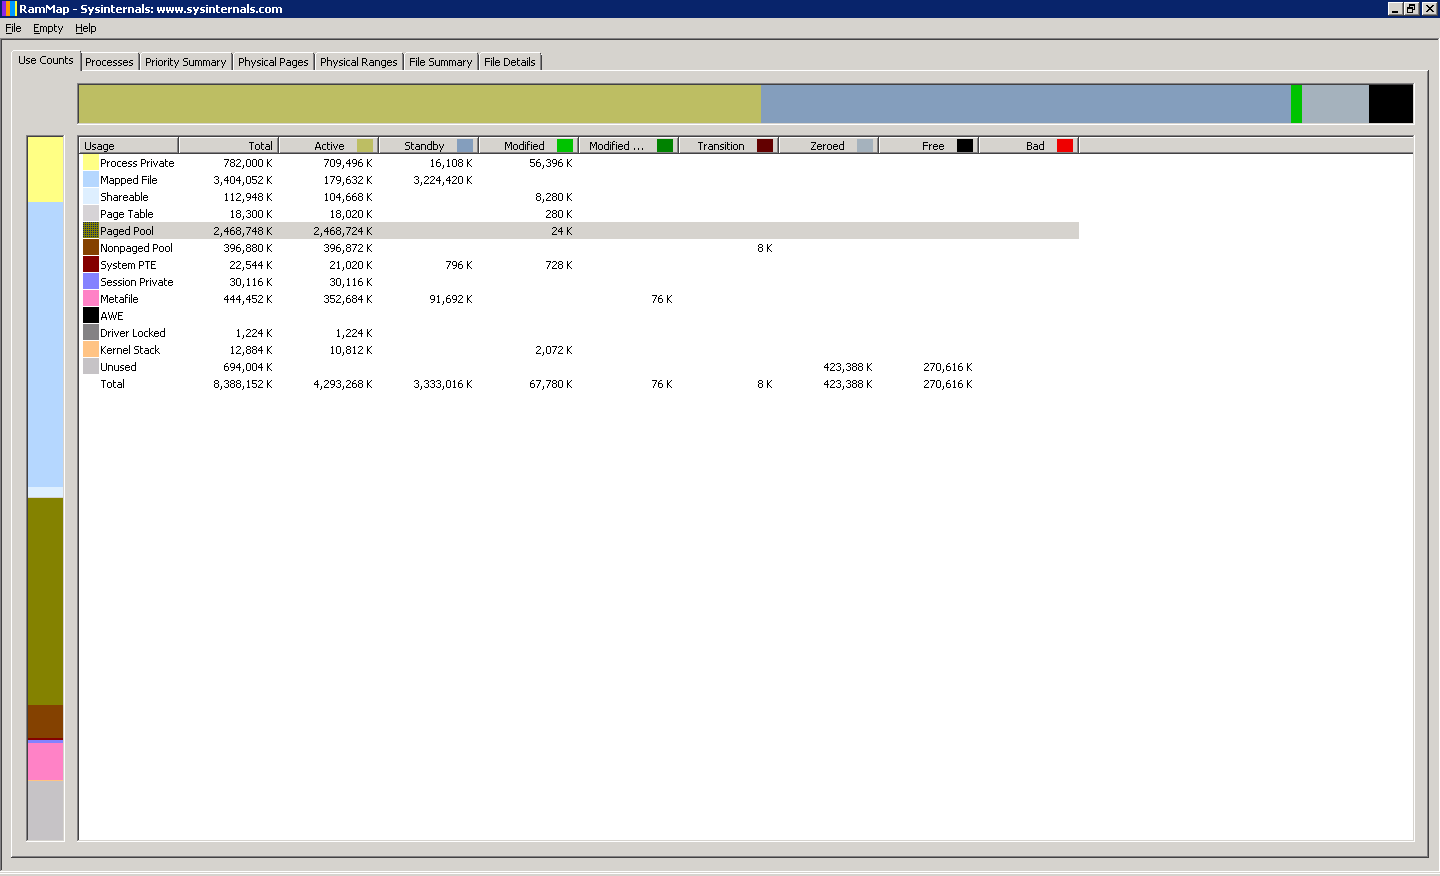
I've done a bunch of research online and came across RAMMap. It tells the same story, though in a bit more detail (see attached screen shot). RAMMap shows Active memory = 4,293,268kb. However, if I go to RAMMap's processes tab and total up the memory used by all the processes it's only about 1GB. So we have 3GB of RAM usage that is not accounted for. Comparing this server to the identical server in our dev/test environment (which doesn't have this problem) I note that the biggest difference in memory usage according to RAMMap is Active Page Pool memory. On the dev/test server it's only about 150MB but on the production server it's almost 2.5GB.
Doing some reading in Russinovich's excellent Windows Internals he states there are two sitations where memory can be used but won't be included in the working set:
* Address Windowing Extension (AWE)
* Large page memory
From RAMMap we can clearly see that AWE is using no memory whatsoever, so that isn't the smoking gun.
According to Technet (http://technet.microsoft.com/en-us/query/aa366720) Large page memory will show up as part of the process private bytes, which I can also see from RAMMap and doesn't differ significantly from the working set (at least not enough to account for 3GB of missing memory!)
So at this point I'm stumped. Any help would be greatly appreciated!
ASKER
Sapphire, thanks for the reply.
Mapped File is "Shareable memory that represents a file on disk", so by definition I would expect that category to be mostly standby memory.
On the File Details tab, the file listed as consuming the most memory is using 118MB. If I total up memory used by all files it is around 250MB.
Mapped File is "Shareable memory that represents a file on disk", so by definition I would expect that category to be mostly standby memory.
On the File Details tab, the file listed as consuming the most memory is using 118MB. If I total up memory used by all files it is around 250MB.
ASKER
Yesterday we took some scheduled down time to restart each service on the server one by one on the theory that one of those services would release about 2.5GB of RAM. After restarting every running service that can be manually restarted "In Use" memory was still at about 3.7GB. We then rebooted the server to get memory consumption back down to normal (somewhere between 800MB and 1.5GB). We were surprised to discover that the server was still using 2.8GB after a reboot. We're now comparing the dev/test server to the prod server to look for any differences that might explain why the dev/test system uses only 800MB when not under load but the production server uses 2.8GB.
ASKER
Memory usage appears to have stabilized around 4GB. We were unable to determine why it increased so much in the first place.
ASKER
I've requested that this question be deleted for the following reason:
Problem has not been solved, and I am no longer actively investigating it.
Problem has not been solved, and I am no longer actively investigating it.
ASKER
I may have found the cause of this issue.
ASKER CERTIFIED SOLUTION
membership
This solution is only available to members.
To access this solution, you must be a member of Experts Exchange.
ASKER
No one on EE identified the solution, which we eventually found on our own.
Also, if you notice, your MAPPED FILE area is 3.4 gigs or so, that is set aside and only 176k of it is active.. but the items are loaded and "allocated" in Memory..
let us know what you find
-sapphire