w00k
asked on
Line Graph - Display correct values for "received" and "completed" service requests
I'm new to Line graphs, so any help with this would be appreciated. I'd like to create a line graph in Crystal Reports with the last 24 months displayed on the x-axis.
On the y-axis I need a integer value that represents a count for:
a."Received" support tickets
b."Completed" support tickets.
I've attached a screen shot of what it should look like (I was able to mock something up quickly in Excel). Here is the problem that I'm having with creating this graph in Crystal...my counts are not showing correctly for "Completed" support tickets because I'm using the "Received" date (sort order = for each month) along the x-axis.
If I switch the "On Change Of" option from "Received" date to "Completed" date, then my "completed" count is correct, but my "Received" count is incorrect. What are my options for getting around this problem or maybe I've missed something all together?
Hope I've explained this good enough for someone to provide guidance. Let me know if more explanation is needed.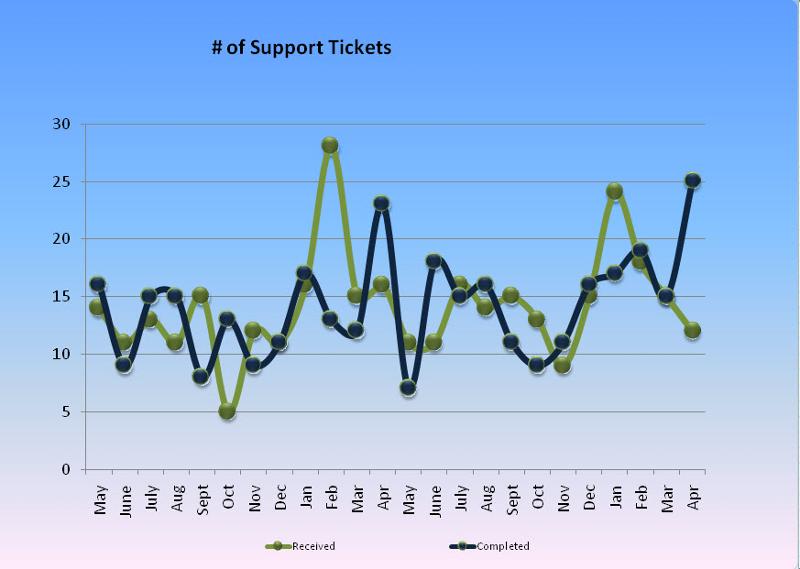

ASKER
Multiple axis chart optioin? No, I have not tried that option, but I'm open to giving it a shot. Where is the option located?
Try this
Open the report
Preview it
Right click the chart
Click CHART OPTIONS
CLick AXES tab
Click DUAL AXES
mlmcc
Open the report
Preview it
Right click the chart
Click CHART OPTIONS
CLick AXES tab
Click DUAL AXES
mlmcc
ASKER
mlmcc,
I don't beleive that is going to do what I need. The problem would still be that the x-axis (month name) is shared between both received and completed requests. Certainly there must be some solution to this problem. What about subreports? Could i accomplish this by using subreports (1 for received requests and another for completed requests)??
I don't beleive that is going to do what I need. The problem would still be that the x-axis (month name) is shared between both received and completed requests. Certainly there must be some solution to this problem. What about subreports? Could i accomplish this by using subreports (1 for received requests and another for completed requests)??
That would do it but you would have 2 separate graphs. You could do it with 2 separate graphs in the main report.
WHat is in each record?
Is it like
SupportId, DateReceived, DateCompleted, other fields
mlmcc
WHat is in each record?
Is it like
SupportId, DateReceived, DateCompleted, other fields
mlmcc
ASKER
mlmcc,
Yes, the data fields in the report includes a received_date, completed_date, request_id and some other fields that I'm not using on my report. If at all possible, I wanted to have one line for received_requests and one line for completed requests on a single chart as shown in the image above. I did try using subreports to get this done (one for received_date and another for completed_date) and all of my counts were correct, but this doesn't help much because I'm not able to plot the values from each of the subreports on my line chart in my main report.
Yes, the data fields in the report includes a received_date, completed_date, request_id and some other fields that I'm not using on my report. If at all possible, I wanted to have one line for received_requests and one line for completed requests on a single chart as shown in the image above. I did try using subreports to get this done (one for received_date and another for completed_date) and all of my counts were correct, but this doesn't help much because I'm not able to plot the values from each of the subreports on my line chart in my main report.
ASKER CERTIFIED SOLUTION
membership
This solution is only available to members.
To access this solution, you must be a member of Experts Exchange.
ASKER
Thanks again mlmcc...this worked exactly how I wanted it to. Much thanks!
Have you tried the multiple axis chart option?
mlmcc