Recommendations for data rendering
I need to render some data and would like some recommendations on my options. This will most likely be an Access/VBA applet or HTA/VBScript application. There will be a primary set of data (4 values), a secondary set of data (3 values = difference between primary set values), and potentially one tertiary set of data (1 value = difference across any 'skipped' primary values).
Nothing skipped example:
One value skipped example:
Two values skipped example:
Nothing skipped example:
1.1
1.2	.1
1.3	.1
1.4 .1One value skipped example:
1.1
1.2 X	.1
1.3	.1	.2
1.4 .1Two values skipped example:
1.1
1.2 X	.1
1.3 X	.1
1.4 .1 .3Scott McDaniel (EE MVE )
I'm not sure what you're asking. Are you asking about the best way to do this, or which of those 3 examples is the "best", or ...
ASKER
@LSM
This data will be displayed at the end of each business day for five sites. Each site will process multiple patients during the day. Right now, I'm trying to make the quality control person's task as efficient and pleasant as possible. My initial thought was that the second and third 'column' data values would be easier to understand if they were connected with lines, indicating to which first column values they pertain. I was also going to add some color to draw the QC person's eyes to the exceptional patients.
I could go 'old school' and use VB drawing and printing statements, but thought that there might be better options to consider.
I see. To me, columnar data always seems more tidy and efficient, and people naturally understand it better. The more you can "stack" the relevant information on top of each other, the better it is for most to understand. So if Column 4 is the more important column, then be sure that Column4 is always in (basically) the same place.
Or perhaps reverse the ordering so that Column 4 is the first column, and the derivatives are to the right.
Shading helps, but I don't think that's really an option in this case.
Or perhaps reverse the ordering so that Column 4 is the first column, and the derivatives are to the right.
Shading helps, but I don't think that's really an option in this case.
If you're going the table format route, you can write HTML on the fly to present data in a standard HTML table. I've written pleny of programs in VBScript that write the body of an HTA based on the data that needs presenting, so I could help you there.
Where is the data coming from in the first place though? Is there something native to its environment that you could use?
While I haven't tried it yet, you should be able to build DHTML code into an HTA to have a decent presentation, something like this:
http://www.dynamicdrive.com/dynamicindex1/navigate1.htm
Or you could building collapsable branches like this:
http://www.dynamicdrive.com/dynamicindex1/switchmenu.htm
Regards,
Rob.
ASKER
I was thinking about something with lines and boxes. (see below)
The problem is that that the default layout of tables is same line for cells in different columns. I really want to offset the second column cells so that they are physically between the cells in the first column.
layout1.jpg
The problem is that that the default layout of tables is same line for cells in different columns. I really want to offset the second column cells so that they are physically between the cells in the first column.
layout1.jpg
OK, well in a table structure you could utilise the "merging" of cells to have the "offset" effect, in which you could have each real cell actualy consist of four merged cells, and the branches offset by two cells.
The lines between them could be an issue, but I'm yet to try anything in practice.
Where is the data coming from? Is it structured? Do we know how many columns there will be?
Rob.
The lines between them could be an issue, but I'm yet to try anything in practice.
Where is the data coming from? Is it structured? Do we know how many columns there will be?
Rob.
ASKER
@Rob
This is coming from a vendor database. There is a set of four 'included' columns (boolean) and four sets of data values associated with items in the first set. These represent spine segments that are scanned. I do a decent job retrieving the relevant rows and iterating the columns in the recordset. I can't replace the program code with SQL. The second and (optional) third columns are strictly calculated values.
This question is about rendering a graphic representation of the data in a way that is easy to comprehend.
I tried mocking up something using a table cell structure, but it hasn't worked. It produces a far too complex mix of spanned cells.
I have found this, which may be more useful:
Dragable DHTML Flowchart
http://www.planet-source-code.com/vb/scripts/ShowCode.asp?lngWId=4&txtCodeId=8968
But actually, I also found this, which looks easier:
http://www.htmlforums.com/css/t-flowchart-using-css-85999.html
The code generates the following when placed in an HTA.
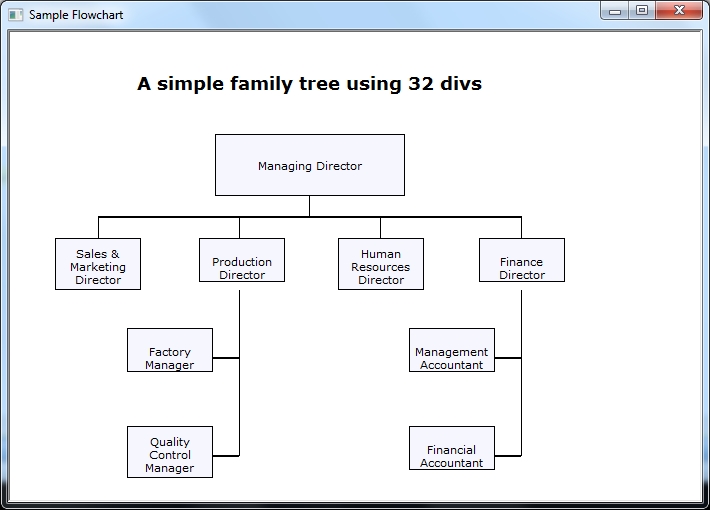
That could be coded on the fly during the data gathering stage.
Regards,
Rob.
I have found this, which may be more useful:
Dragable DHTML Flowchart
http://www.planet-source-code.com/vb/scripts/ShowCode.asp?lngWId=4&txtCodeId=8968
But actually, I also found this, which looks easier:
http://www.htmlforums.com/css/t-flowchart-using-css-85999.html
The code generates the following when placed in an HTA.
That could be coded on the fly during the data gathering stage.
Regards,
Rob.
ASKER
very interesting, Rob
I haven't looked at it in depth, but tomorrow I'll see if I can play around with it and get the "double lines" between boxes.
Rob.
Rob.
I just saw something else that presented an idea that should be easier to implement. We could use a normal table structure, but for the the lines, use a series of images that "join" the text boxes.
What are your thoughts on that for the structure that you've shown?
Rob.
What are your thoughts on that for the structure that you've shown?
Rob.
ASKER
The thing I was trying to accomplish (appearance wise) was to have the second column cells appear half way between the first column cells (vertically).
ASKER CERTIFIED SOLUTION
membership
This solution is only available to members.
To access this solution, you must be a member of Experts Exchange.
ASKER
wonderful. Since VML is deprecated, do you know of an SVG implementation?
VML still runs in IE9, but I'll have a crack at converting it to SVG for you.
Rob.
Rob.
Hi, I have IE8, and can't get SVG to work in it. I just found out that IE8 or less did not provide native SVG support. You will therefore only be able to use SVG if you run IE9 or greater. If you *do* run that exclusively, I could install IE9 and convert it....
I was using the VML to SVG Migration Guide here to try it:
http://www.microsoft.com/download/en/details.aspx?id=5224
Regards,
Rob.
I was using the VML to SVG Migration Guide here to try it:
http://www.microsoft.com/download/en/details.aspx?id=5224
Regards,
Rob.
I just tried the sample at the bottom of that document in a HTA with IE9, and this line caused an error:
mySvg = document.createElementNS(s
which is the same I got on IE8. I don't know enough about javascript, or SVG, but I can't find anything about alternatives for IE.
Regards,
Rob.
mySvg = document.createElementNS(s
which is the same I got on IE8. I don't know enough about javascript, or SVG, but I can't find anything about alternatives for IE.
Regards,
Rob.
ASKER
@Rob
I've use Chrome and have IE7. I think this client uses IE8. According to the Microsoft forums, SVG support was supposed to have been included with IE8. I'm disappointed that it wasn't.
I think I'll just render something simple (and sub-optimal) until the browsers catch up or HTML5 replaces SVG (rumored).
Your VML comment is the closest to achieving what I want to show the user, so I'll accept that as the solution. Thanks.
ASKER
What I was looking for. Thanks.
No problem. Thanks for the grade. If you need help transferring your data into the raw code, let me know.
Regards,
Rob.
Regards,
Rob.