Microsoft Excel
--
Questions
--
Followers
Top Experts
How do I create an Exploded Bar Chart?
I came across this graph in today's newspaper (publicly available data):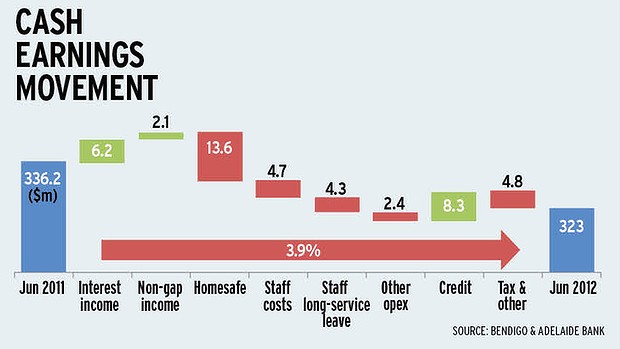
The green items add to the blue base amount cumulative running total and the red items subtract from it, resulting in the end cumulative blue bar.
How do I create such an Exploded Bar Chart in either Microsoft Excel, Apple Numbers or other software?
The green items add to the blue base amount cumulative running total and the red items subtract from it, resulting in the end cumulative blue bar.
How do I create such an Exploded Bar Chart in either Microsoft Excel, Apple Numbers or other software?
Zero AI Policy
We believe in human intelligence. Our moderation policy strictly prohibits the use of LLM content in our Q&A threads.
ASKER CERTIFIED SOLUTION
membership
Log in or create a free account to see answer.
Signing up is free and takes 30 seconds. No credit card required.
Excellent! Exactly what I am looking for!


EARN REWARDS FOR ASKING, ANSWERING, AND MORE.
Earn free swag for participating on the platform.
Microsoft Excel
--
Questions
--
Followers
Top Experts
Microsoft Excel topics include formulas, formatting, VBA macros and user-defined functions, and everything else related to the spreadsheet user interface, including error messages.