Diaphanosoma
asked on
ODS layout / region not working for me
Hi,
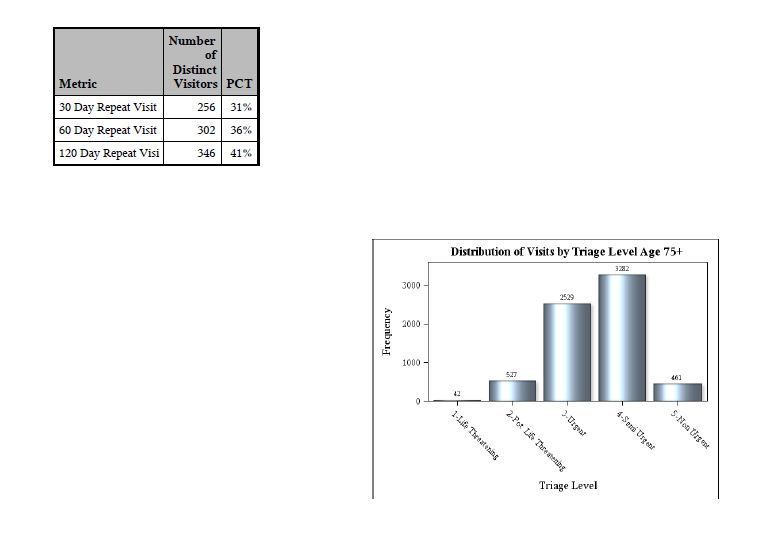
I'm trying to create a report that I want to use the ods layout feature of SAS. The code as I have it, places two of three items but not exactly where I would like them and the third never shows up at all (error: NOTE: The graph will be rendered as an image due to the use of data skins.
WARNING: The absolute region was too small to accommodate the text supplied. OUTPUT WAS LOST.)
I've tried making the region bigger, etc, but it never comes out.
I would like the layout to look something like
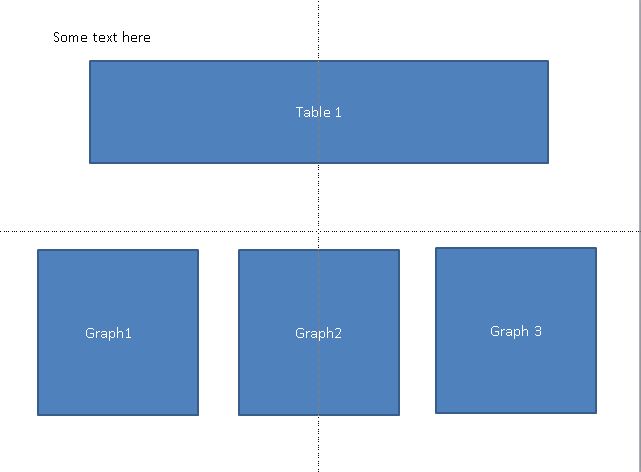
And what I'm getting is:
All the examples on the web make it look so easy, but I can't get the darn graphs in the right place.
Code :
I'm trying to create a report that I want to use the ods layout feature of SAS. The code as I have it, places two of three items but not exactly where I would like them and the third never shows up at all (error: NOTE: The graph will be rendered as an image due to the use of data skins.
WARNING: The absolute region was too small to accommodate the text supplied. OUTPUT WAS LOST.)
I've tried making the region bigger, etc, but it never comes out.
I would like the layout to look something like
And what I'm getting is:
All the examples on the web make it look so easy, but I can't get the darn graphs in the right place.
Code :
Options  nodate  orientation=landscape;
ods pdf file="c:\ods_outputs\%trim(%sysfunc(dequote(%scan(&hospital_name.,&i,'+')))).pdf"
 startpage=never ;
ods layout start height = 8.5in width = 11in;

ods region width=11in height=.75in x=0in y=0in;
	ods pdf text="Summary of ED visits at %trim(%sysfunc(dequote(%scan(&hospital_name.,&i,'+')))) hospital. People Age 65+ 2011/12 Fiscal Year";

ods region width=4.5in height=3in x=0.25in y=1in;
proc print data=new noobs label;
var metric distinct_visitor percent;run;

ods region width=3in height=3in x=0.25in y=3.5in;
proc sgplot data=t_75;
xaxis type=discrete;
vbar Triage_level1 /
dataskin=sheen
datalabel;
title 'Distribution of Visits by Triage Level Age 75+';


ods region width=4in height=5in x=5in y=3.5in;
proc sgplot data=t_75;
xaxis type=discrete;
vbar disposition /
dataskin=sheen
datalabel;
title 'Disposition Status Age 75+';
run;

ods layout end;
ods pdf close;
%end;
%mend;ASKER CERTIFIED SOLUTION
membership
This solution is only available to members.
To access this solution, you must be a member of Experts Exchange.
ASKER
Its been a while since a missing run statement got me flummoxed.
Thanks,
Bruce