Excel VBA- capture screenshot image dynamically
Hi Experts! :)
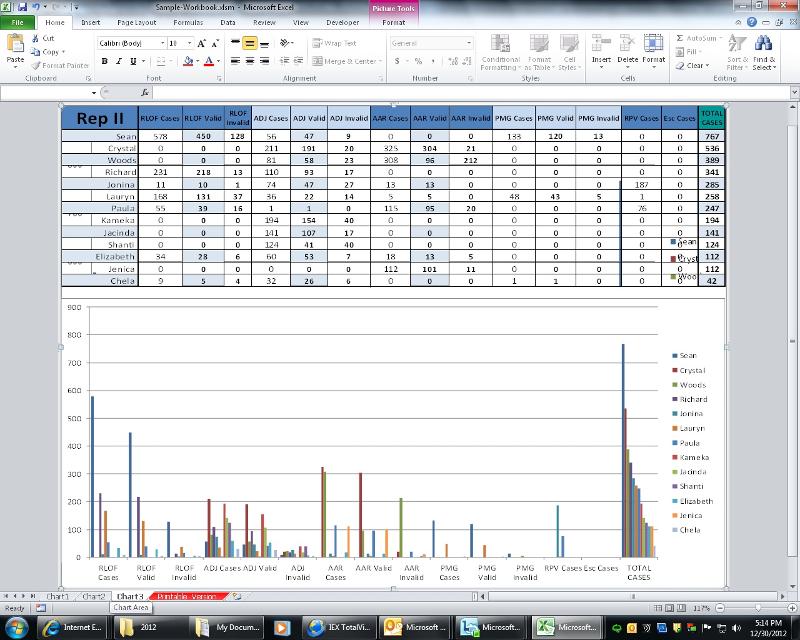
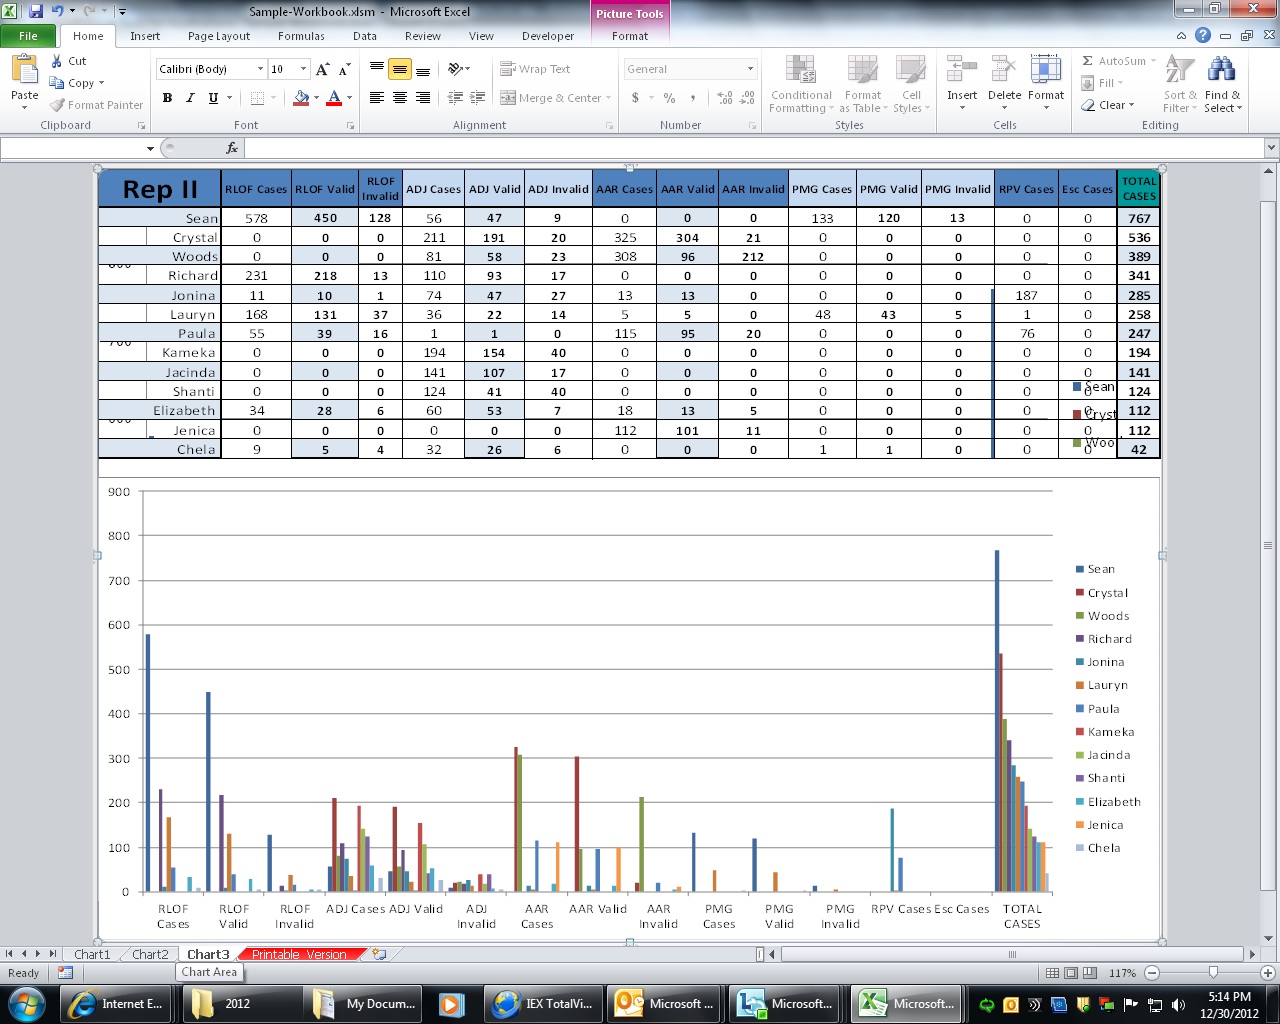
I posted a question a few days ago regarding taking a screenshot of an excel worksheet's data area and then embedding that screenshot into the body of an email message composed in MS Outlook 2010. The expert who assisted successfully answered my question and the code works great!
Below is a link to the previous answered post with the sample code and workbook:
Previous Screenshot/ Embed Image in Outlook 2010 email message body post
My question now is it possible to make it dynamic meaning if the data area size changes is it possible to have to code auto adjust to the new data range? Right now its set for the current size A1:P40 in this part of the code.
Private Sub cmdEmail_Click()
Dim oRange As Range
Dim oCht As Chart
Dim oImg As Picture
Set oRange = Range("A1:P40")
Set oCht = Charts.Add
oRange.CopyPicture xlScreen, xlPicture
oCht.Paste
oCht.Export Filename:="C:\Temp\SavedRange.jpg", Filtername:="JPG"
Screenshot_Mail "Sample Email Address" & "; " & "Sample Email Address", "Sample Email Address" & _
"; " & "Sample Email Address" & "; " & "Sample Email Address", "Rep II Case Productivity Report", "<font color=red>" & _
"<I>" & "Below is a Snapshot View of the Rep II Case Productivity Report: " & "</font>" & "</I>" & _
"<BR>" & "<BR>" & "<BODY><FONT face=Arial color=#000080 size=2></FONT>" & _
"<IMG alt='' hspace=0 src='C:\Temp\SavedRange.jpg' align=baseline border=0> </BODY>"
DoEvents
oCht.Delete
End Subshorvath
If you create your charts dynamically, you can save the range you used, and pass it to the email function.
ASKER
@shorvath, if the range of data above the chart change in size due to increased rows and the chart gets shifted downward would the "set range" in the code capture all of the data? I may not be grasping your recommendation. If I save the range used and the data later increases or decreases will the screenshot portion of the code capture the new range? The chart properties are set not to "move or change in size".
Thank you for your help! :)
Thank you for your help! :)
abys757
I understand that the data in your grid is dynamic and can have any number of rows and columns. What I am trying to say, is that at some point your macro that inserts the data must keep track of how many rows are on the sheet, because you have to set the Charts Data Range. Your current Data Range is ='Printable_Version'!$A$1:
Now we can reposition the Chart based on finding the first blank row on the sheet using the following code. You can test this by shifting the chart down and to the right of it's current position. The code will detect the first blank row, shift the chart and reset the range.
replace your cmdEmail_Click code with this:
Private Sub cmdEmail_Click()
Dim oRange As Range
Dim oCht As Chart
Dim oImg As Picture
Dim iGetRows As Integer
Dim strRange As String
iGetRows = Worksheets("Printable_Version").Cells.Find("*", _
Worksheets("Printable_Version").Cells(1), xlFormulas, _
xlWhole, xlByRows, xlPrevious).Row
strRange = "A1:P" & CStr(iGetRows + 25)
Set oCht = Charts.Add
DoEvents
Call AdjustChart
Set oRange = Range(strRange)
oRange.CopyPicture xlScreen, xlPicture
oCht.Paste
oCht.Export Filename:="C:\Temp\SavedRange.jpg", Filtername:="JPG"
Screenshot_Mail "Sample Email Address" & "; " & "Sample Email Address", "Sample Email Address" & _
"; " & "Sample Email Address" & "; " & "Sample Email Address", "Rep II Case Productivity Report", "<font color=red>" & _
"<I>" & "Below is a Snapshot View of the Rep II Case Productivity Report: " & "</font>" & "</I>" & _
"<BR>" & "<BR>" & "<BODY><FONT face=Arial color=#000080 size=2></FONT>" & _
"<IMG alt='' hspace=0 src='C:\Temp\SavedRange.jpg' align=baseline border=0> </BODY>"
DoEvents
oCht.Delete
End Sub
Public Sub AdjustChart()
Dim oChtObj As ChartObject
Dim oRng As Range
Dim iGetRows As Integer
Dim strRange As String
iGetRows = Worksheets("Printable_Version").Cells.Find("*", _
Worksheets("Printable_Version").Cells(1), xlFormulas, _
xlWhole, xlByRows, xlPrevious).Row
strRange = "A" & CStr(iGetRows + 2) & ":P" & CStr(iGetRows + 25)
Worksheets("Printable_Version").Activate
ActiveSheet.ChartObjects("Chart 3").Activate
Set oChtObj = ActiveChart.Parent
Set oRng = ActiveSheet.Range(strRange)
oChtObj.Left = oRng.Left
oChtObj.Width = oRng.Width
oChtObj.Top = oRng.Top
oChtObj.Height = oRng.Height
Set oChtObj = Nothing
Set oRng = Nothing
End SubASKER
Hi shorvath.. sorry about the delayed response but I've been away from computer access. :)
I tried the revised code but for some reason it jumbles the row data with the chart image.
Would you recommend I move the chart above the data range? This way the chart image can stay static according to its properties size settings and the rows in the data range can increase or decrease in number. I have novice abilities at best with vb so let me know if I sound confusing. Again thank you for your time.
ASKER CERTIFIED SOLUTION
membership
This solution is only available to members.
To access this solution, you must be a member of Experts Exchange.
ASKER
shorvath: Your workbook sample did work just fine. Not sure why mine was slightly merged. I appreciate your assistance!
ASKER
shorvath: Don't mean to be bother but I have a quick question ... I've come to a cross road where I'm requested to have the chart above the data area afterall ... Is there a simple way to mod your given code to accomodate? If needed I'll open an additional question to ensure proper point compensation.
Thank you,
Thank you,