Adding Chart to Web Page
We have a MYSQL/PHP database and want to add a chart to the web[age that shows the total amount of exercise per day over a period of time. Is there a nice chart plugin we could use for this?
The fields in the table are called exercise_id, exercise_time and exercise_timestamp.
Thanks for the help,
D
The fields in the table are called exercise_id, exercise_time and exercise_timestamp.
Thanks for the help,
D
I've used JPGraph with very good success. http://jpgraph.net/
Check out this plugins
http://phpchart.net/
http://www.rgraph.net/ (HTML5)
http://www.maani.us/charts/index.php (FLASH)
https://developers.google.com/chart/?hl=pt-PT
http://phpchart.net/
http://www.rgraph.net/ (HTML5)
http://www.maani.us/charts/index.php (FLASH)
https://developers.google.com/chart/?hl=pt-PT
Google charts is very easy to work with and produces customizable charts that blend seamlessly with your existing pages.
I pull data from SQL server, populate into an array and send the array to a Google API to produce this chart:
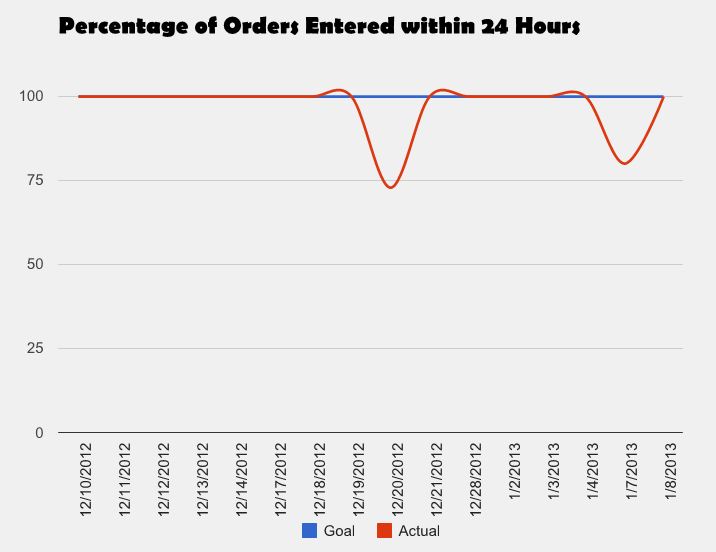
I pull data from SQL server, populate into an array and send the array to a Google API to produce this chart:
ASKER
Thanks everyone,
I'm looking to make a simple chart that shows a person's exercise practice over time. User's can track their exercise times in minutes in the database. I would like to setup a simple line chart that shows on the vertical axis the minutes they exercised and on the horizontal axis the month of the year. If the chart could automatically resize to the amount of user data in the database that would be ideal. (E.g. if they have only exercised for one month it would show each day in details whereas if they have a year's worth of data it would show the data in months on the horizontal access). Could anyone provide a simple example of this? I have tried to do this myself using 3 of the programs suggest above (Float Chart, Google Charts and PHPChart) but as I'm not a seasoned PHP developer I'm finding it difficult to set it up.
Thanks for your help,
D
ASKER
If it helps, our database table is called exercise_table and the fields are:
exercise_id (ai)
exercise_duration (int in minutes)
exercise_timestamp
user_id
exercise_id (ai)
exercise_duration (int in minutes)
exercise_timestamp
user_id
ASKER
I can get all the necessary information from the database, I just can't figure out how to link it with the charts and the best chart system to use so that the view is automatically adjusted based on the amount of content for that user.
ASKER CERTIFIED SOLUTION
membership
This solution is only available to members.
To access this solution, you must be a member of Experts Exchange.
ASKER
Hi dimmergeek, we are using PHP/MYSQL. Will this work in the example you presented also?
Yes, the data source does not matter. Once you have your data, you just build an array table with it and then call the API.
Thanks for the points and good luck!
http://www.maani.us/xml_ch
http://naku.dohcrew.com/li
http://teethgrinder.co.uk/
http://pchart.sourceforge.