BWFC
asked on
How do I Change Labels on a Chart Axis to Show Individual Months Only
I have created a series of charts in Report Builder 3.0 showing disk space usage over time. The charts have the date along the x axis and at the moment the labels are showing every second day with the month and year. These charts are potentially infinitely expandable so I'd like to have one label per month just showing the discrete month and year if possible. Can anybody help please?
ASKER CERTIFIED SOLUTION
membership
This solution is only available to members.
To access this solution, you must be a member of Experts Exchange.
Thank you for the points, although seems undeserved.
Most graphic packages have their own "tricks", and a date range on the X axis can be "tricky" - however it will boil down to the tick marks in some way shape or form.
How to: Format Axis Labels as Dates or Currencies (Report Builder 3.0 and SSRS)
How to: Specify an Axis Interval (Report Builder 3.0 and SSRS)
Most graphic packages have their own "tricks", and a date range on the X axis can be "tricky" - however it will boil down to the tick marks in some way shape or form.
How to: Format Axis Labels as Dates or Currencies (Report Builder 3.0 and SSRS)
When you show properly formatted DateTime values on an axis, a chart will automatically display these values as days. To specify a date/time interval for the x-axis, such as an interval of months or an interval of hours, you must format the axis labels and set the type of axis interval to a valid date or time interval.I think the secret is within the one immediately above, which is confirmed by the next reference.
How to: Specify an Axis Interval (Report Builder 3.0 and SSRS)
This topic is not applicable for date or time values on the category axis. Be default, DateTime values appear as days. To specify a different date or time interval, such as a month or time interval, you must format the axis labels and set the axis to display instances of DateTime types instead of String types. In addition, you must set the Interval property. For more information, see How to: Format Axis Labels as Dates or Currencies (Report Builder 3.0 and SSRS).{+ edit for emphasis on "interval"}
ASKER
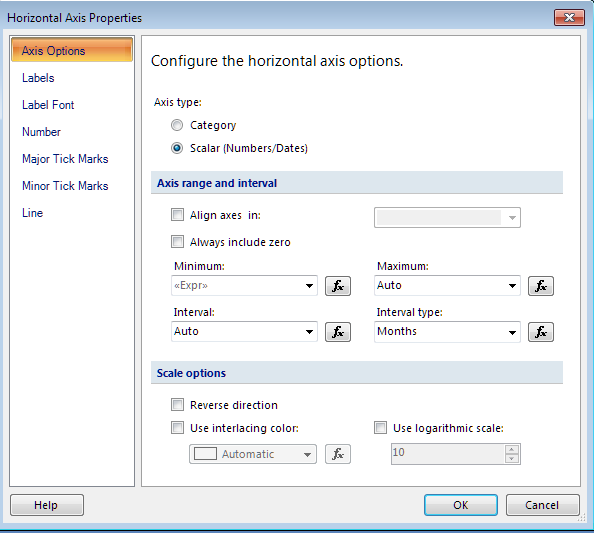
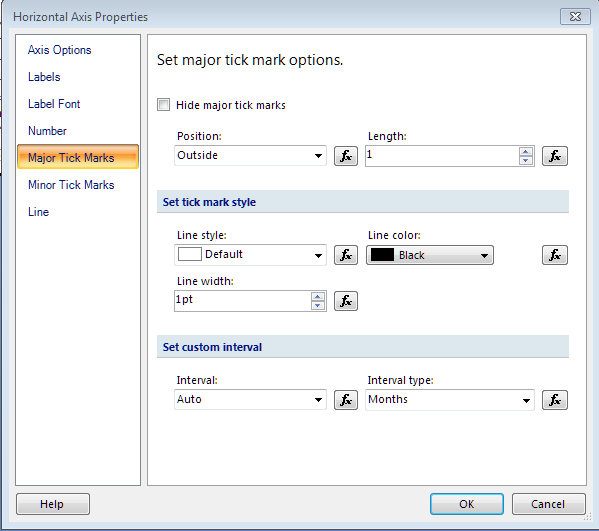
Hi, I think I've got all the settings set to show months but it's still not giving me the single label per month. The Number format I'm using is *January 2000. Are the settings on the screenshots correct? The expression on minimum axis range makes no difference whether it is there or not.
You have not "set" the interval, but allowed "auto" (in both)
You will only know for sure by "playing" with these, but I think you need to actually specify the interval (in both most likely) - can you try it?
You will only know for sure by "playing" with these, but I think you need to actually specify the interval (in both most likely) - can you try it?
ASKER
I've just had that realisation myself! A lot of the internet searches came back saying "the Interval will show this" so I thought when I could only see 'Auto' as an option it was something to do with my version of Report Builder or my data (I'm very new to SQL and BI) . I think I'm going to need something involving datediff and/or datepart to get the discrete months to show as labels.
maybe a new question - with your existing query? and a mock-up of your expected outcome?
a fresh start might help
a fresh start might help
ASKER
I'm not sure I explained what I wanted to do particularly clearly because after chatting with the rest of the BI team and further Google searches I don't think want I want to do is actually possible with the data I have.
Thanks for your help.