BSOD -- analylzing dmp file
Running Windows 7 Professional SP-1, I've had 4-5 instances of BSOD over the past month. Some of them are PFN_LIST_CORRUPT and some are IRQL_NOT_LESS_OR_EQUAL. I have WER-sysdata and minidump files associated with the crashes.
I've tested my hard disks, and one of them needed to be replaced, but the BSOD have continued. I ran memtest86, which did not report any problems. Driver verifier found a driver issue, but I've used that driver for years without incident. Updating to the most recent version of the driver didn't prevent BSOD from happening.
I'm trying to use Windows Debugging Tools to analyze the .dmp files associated with these events, but I have no experience with this. The console window says "Loading User Symbols", and nothing further appears there. The "Symbols" folder has some contents, but I don't know its significance. Guidance would be appreciated.
SOLUTION
membership
This solution is only available to members.
To access this solution, you must be a member of Experts Exchange.
Any major changes to the system lately?
Any changes/updates to the drivers? In particular- the NIC?
Have you run the system file checker? SFC /Scannow. Save your data and try running that.
Any changes/updates to the drivers? In particular- the NIC?
Have you run the system file checker? SFC /Scannow. Save your data and try running that.
ASKER
There are frequent changes to the system. The most major change was replacement of the system hard disc, after the first BSOD, when the previous disc was found to fail some tests. I use RamDisk by SuperSpeed, and I updated the driver, because it caused BSOD during driver verifier. The updated driver causes a BSOD with driver verifier as well. I ran SFC with no apparent errors. There haven't been recent changes to NIC drivers or network hardware.
Can you upload us the Minidumps from %SystemRoot%\windows\minid
ASKER
112313-25272-01.dmp
120713-30154-01.dmp
121113-28267-01.dmp
Here are three .dmp files associated with PFN_LIST_CORRUPT BSOD. The BSOD which was IRQ_NOT_LESS_OR_EQUAL didn't produce a .dmp file because, somehow, the configuration setting to generate a report was changed to "no report." I've set it back to generate a minidump.
121113 and 120713 says : IMAGE_NAME: memory_corruption
try replacing the ram
try replacing the ram
ASKER
Thank you for your recommendation. I will try replacing one module at a time, and I'll post back afterwards. May I ask, wouldn't memtest86 have discovered a memory issue? One other question: I'm looking at those dmp files with BlueScreenView, and I don't see any mention of "IMAGE_NAME: memory_corruption". Where do you find that reference?
>> May I ask, wouldn't memtest86 have discovered a memory issue? << Normally YES
but there is NO diagnostic or software that covers all possible failures, so i always tell the people that a diag is ok for 99%.
But it keeps being possible it is something else; eg : ram controller, internal cache in the cpu, or even motherboard
but there is NO diagnostic or software that covers all possible failures, so i always tell the people that a diag is ok for 99%.
But it keeps being possible it is something else; eg : ram controller, internal cache in the cpu, or even motherboard
ASKER
Thank you. I would still like to know where in the .dmp file report you were able to see "IMAGE_NAME: memory_corruption"?
ASKER CERTIFIED SOLUTION
membership
This solution is only available to members.
To access this solution, you must be a member of Experts Exchange.
ASKER
What application are you using to examine the .dmp file?
Windbg is "Debugging Tools for Windows", or what you called "Windows Debugging Tools". In the File menu you will find "Open Crash Dump", which is exactly what you'll need.
Setting up the correct symbol path requires a symbol server for downloading the corresponding PDB files (symbol files). Usually you set that up as
srv*c:\Symbols*http://msdl.microsoft.com/download/symbols
where C:\Symbols is where the files should be stored. You should always use the same path, as the Windows PDB files are large and many, and downloading them requires a lot of time. Hence it is a good idea to set the environment variable _NT_SYMBOL_PATH to that value shown above (unless you have another debugger/IDE like Visual Studio in use on that machine).
ASKER
I'm trying to reproduce Nobus' findings. Using Windbg 6.5.000.3.7. Here is a screen shot of the console. I don't know how to find the report which describes the memory issue. 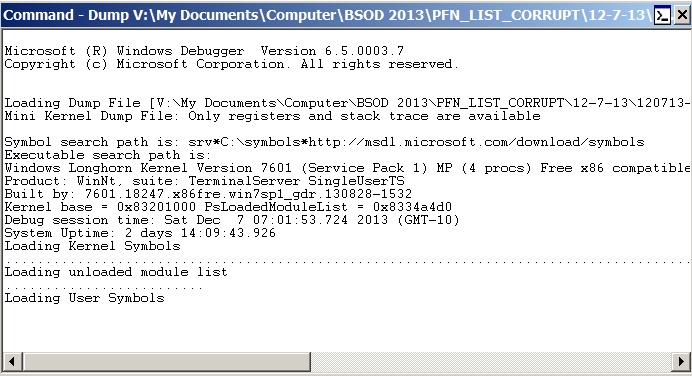
there's alot after the user symbols, see here the first part :
Microsoft (R) Windows Debugger Version 6.2.9200.20512 AMD64
Copyright (c) Microsoft Corporation. All rights reserved.
Loading Dump File [C:\Users\Nobus64\Download
Mini Kernel Dump File: Only registers and stack trace are available
Symbol search path is: .sympath SRV*c:\localsymbols*http://msdl.microsoft.com/download/symbols;symsrv*symsrv.dll*c:\symbols*http://msdl.microsoft.com/download/symbols
Executable search path is:
Windows 7 Kernel Version 7601 (Service Pack 1) MP (4 procs) Free x86 compatible
Product: WinNt, suite: TerminalServer SingleUserTS
Built by: 7601.18247.x86fre.win7sp1_
Machine Name:
Kernel base = 0x8321b000 PsLoadedModuleList = 0x833644d0
Debug session time: Wed Dec 11 10:20:30.262 2013 (UTC + 1:00)
System Uptime: 2 days 9:32:12.089
Loading Kernel Symbols
..........................
..........................
..........................
..
Loading User Symbols
Loading unloaded module list
..........................
**************************
* *
* Bugcheck Analysis *
* *
**************************
UseMicrosoft (R) Windows Debugger Version 6.2.9200.20512 AMD64
Copyright (c) Microsoft Corporation. All rights reserved.
Loading Dump File [C:\Users\Nobus64\Download
Mini Kernel Dump File: Only registers and stack trace are available
Symbol search path is: .sympath SRV*c:\localsymbols*http://msdl.microsoft.com/download/symbols;symsrv*symsrv.dll*c:\symbols*http://msdl.microsoft.com/download/symbols
Executable search path is:
Windows 7 Kernel Version 7601 (Service Pack 1) MP (4 procs) Free x86 compatible
Product: WinNt, suite: TerminalServer SingleUserTS
Built by: 7601.18247.x86fre.win7sp1_
Machine Name:
Kernel base = 0x8321b000 PsLoadedModuleList = 0x833644d0
Debug session time: Wed Dec 11 10:20:30.262 2013 (UTC + 1:00)
System Uptime: 2 days 9:32:12.089
Loading Kernel Symbols
..........................
..........................
..........................
..
Loading User Symbols
Loading unloaded module list
..........................
**************************
* *
* Bugcheck Analysis *
* *
**************************
Use !analyze -v to get detailed debugging information.
BugCheck 4E, {9a, 5ae7e, 6, 5}
Probably caused by : memory_corruption ( nt!MiBadRefCount+26 )
Followup: MachineOwner
---------
-v to get detailed debugging information.
BugCheck 4E, {9a, 5ae7e, 6, 5}
Probably caused by : memory_corruption ( nt!MiBadRefCount+26 )
Followup: MachineOwner
---------
Microsoft (R) Windows Debugger Version 6.2.9200.20512 AMD64
Copyright (c) Microsoft Corporation. All rights reserved.
Loading Dump File [C:\Users\Nobus64\Download
Mini Kernel Dump File: Only registers and stack trace are available
Symbol search path is: .sympath SRV*c:\localsymbols*http://msdl.microsoft.com/download/symbols;symsrv*symsrv.dll*c:\symbols*http://msdl.microsoft.com/download/symbols
Executable search path is:
Windows 7 Kernel Version 7601 (Service Pack 1) MP (4 procs) Free x86 compatible
Product: WinNt, suite: TerminalServer SingleUserTS
Built by: 7601.18247.x86fre.win7sp1_
Machine Name:
Kernel base = 0x8321b000 PsLoadedModuleList = 0x833644d0
Debug session time: Wed Dec 11 10:20:30.262 2013 (UTC + 1:00)
System Uptime: 2 days 9:32:12.089
Loading Kernel Symbols
..........................
..........................
..........................
..
Loading User Symbols
Loading unloaded module list
..........................
**************************
* *
* Bugcheck Analysis *
* *
**************************
Use !analyze -v to get detailed debugging information.
BugCheck 4E, {9a, 5ae7e, 6, 5}
Probably caused by : memory_corruption ( nt!MiBadRefCount+26 )
Followup: MachineOwner
then i used the !analyze -v command
---------
Microsoft (R) Windows Debugger Version 6.2.9200.20512 AMD64
Copyright (c) Microsoft Corporation. All rights reserved.
Loading Dump File [C:\Users\Nobus64\Download
Mini Kernel Dump File: Only registers and stack trace are available
Symbol search path is: .sympath SRV*c:\localsymbols*http://msdl.microsoft.com/download/symbols;symsrv*symsrv.dll*c:\symbols*http://msdl.microsoft.com/download/symbols
Executable search path is:
Windows 7 Kernel Version 7601 (Service Pack 1) MP (4 procs) Free x86 compatible
Product: WinNt, suite: TerminalServer SingleUserTS
Built by: 7601.18247.x86fre.win7sp1_
Machine Name:
Kernel base = 0x8321b000 PsLoadedModuleList = 0x833644d0
Debug session time: Wed Dec 11 10:20:30.262 2013 (UTC + 1:00)
System Uptime: 2 days 9:32:12.089
Loading Kernel Symbols
..........................
..........................
..........................
..
Loading User Symbols
Loading unloaded module list
..........................
**************************
* *
* Bugcheck Analysis *
* *
**************************
UseMicrosoft (R) Windows Debugger Version 6.2.9200.20512 AMD64
Copyright (c) Microsoft Corporation. All rights reserved.
Loading Dump File [C:\Users\Nobus64\Download
Mini Kernel Dump File: Only registers and stack trace are available
Symbol search path is: .sympath SRV*c:\localsymbols*http://msdl.microsoft.com/download/symbols;symsrv*symsrv.dll*c:\symbols*http://msdl.microsoft.com/download/symbols
Executable search path is:
Windows 7 Kernel Version 7601 (Service Pack 1) MP (4 procs) Free x86 compatible
Product: WinNt, suite: TerminalServer SingleUserTS
Built by: 7601.18247.x86fre.win7sp1_
Machine Name:
Kernel base = 0x8321b000 PsLoadedModuleList = 0x833644d0
Debug session time: Wed Dec 11 10:20:30.262 2013 (UTC + 1:00)
System Uptime: 2 days 9:32:12.089
Loading Kernel Symbols
..........................
..........................
..........................
..
Loading User Symbols
Loading unloaded module list
..........................
**************************
* *
* Bugcheck Analysis *
* *
**************************
Use !analyze -v to get detailed debugging information.
BugCheck 4E, {9a, 5ae7e, 6, 5}
Probably caused by : memory_corruption ( nt!MiBadRefCount+26 )
Followup: MachineOwner
---------
-v to get detailed debugging information.
BugCheck 4E, {9a, 5ae7e, 6, 5}
Probably caused by : memory_corruption ( nt!MiBadRefCount+26 )
Followup: MachineOwner
---------
Microsoft (R) Windows Debugger Version 6.2.9200.20512 AMD64
Copyright (c) Microsoft Corporation. All rights reserved.
Loading Dump File [C:\Users\Nobus64\Download
Mini Kernel Dump File: Only registers and stack trace are available
Symbol search path is: .sympath SRV*c:\localsymbols*http://msdl.microsoft.com/download/symbols;symsrv*symsrv.dll*c:\symbols*http://msdl.microsoft.com/download/symbols
Executable search path is:
Windows 7 Kernel Version 7601 (Service Pack 1) MP (4 procs) Free x86 compatible
Product: WinNt, suite: TerminalServer SingleUserTS
Built by: 7601.18247.x86fre.win7sp1_
Machine Name:
Kernel base = 0x8321b000 PsLoadedModuleList = 0x833644d0
Debug session time: Wed Dec 11 10:20:30.262 2013 (UTC + 1:00)
System Uptime: 2 days 9:32:12.089
Loading Kernel Symbols
..........................
..........................
..........................
..
Loading User Symbols
Loading unloaded module list
..........................
**************************
* *
* Bugcheck Analysis *
* *
**************************
Use !analyze -v to get detailed debugging information.
BugCheck 4E, {9a, 5ae7e, 6, 5}
Probably caused by : memory_corruption ( nt!MiBadRefCount+26 )
Followup: MachineOwner
then i used the !analyze -v command
---------
ASKER
Thank you for supplying that output. Maybe I didn't let the bugcheck run long enough. I left it for around a half hour, and nothing appeared after what shows in the screen shot.
it does not take 2 minutes here, so probably you have aother problems :
a corrupt OS, or bad hardware
you can test by running the debug on a working pc
a corrupt OS, or bad hardware
you can test by running the debug on a working pc
It might last the first time you do that, because the necessary PDB files need to be downloaded. Check your symbol folder for changes. But is should not last 30 minutes or more...
ASKER
To test debug on a working pc, would I use the crash dump from the problem pc, but run the utility on the working one?
Yes, you can use any PC for crash dump analysis. It is even a good idea to use always the same one if you have to do that often.
ASKER
I got the same result using a computer which isn't having BSOD issues. "Loading unloaded module list" is the last entry. No bugcheck analysis after that.
and which dmp file are you using?
ASKER
I've tried with 120713-30154-01.dmp and 121113-28267-01.dmp
If set the symbol path, and then opened 120713-30154-01.dmp as crash dump in WinDbg, and that is the result:
Loading Dump File [C:\temp\ee\120713-30154-01.dmp]
Mini Kernel Dump File: Only registers and stack trace are available

Symbol search path is: srv*c:\WebSymbols*http://msdl.microsoft.com/download/symbols
Executable search path is:
Windows 7 Kernel Version 7601 (Service Pack 1) MP (4 procs) Free x86 compatible
Product: WinNt, suite: TerminalServer SingleUserTS
Built by: 7601.18247.x86fre.win7sp1_gdr.130828-1532
Machine Name:
Kernel base = 0x83201000 PsLoadedModuleList = 0x8334a4d0
Debug session time: Sat Dec  7 18:01:53.724 2013 (UTC + 1:00)
System Uptime: 2 days 14:09:43.926
Loading Kernel Symbols
...............................................................
................................................................
................................................................
..
Loading User Symbols
Loading unloaded module list
.........................
*******************************************************************************
*                                                                             *
*                        Bugcheck Analysis                                    *
*                                                                             *
*******************************************************************************

Use !analyze -v to get detailed debugging information.

BugCheck 4E, {9a, cbdbb, 6, b}

Probably caused by : memory_corruption ( nt!MiBadRefCount+26 )

Followup: MachineOwner
---------ASKER
Thank you. For some reason, I can't get the debugging tool to display a bugcheck report.
I am using Superspeed's RamDisk Plus, so my paging file is on a RamDisk. But that has worked fine for a couple of years without any BSOD, so I didn't suspect it was causing this.
I am using Superspeed's RamDisk Plus, so my paging file is on a RamDisk. But that has worked fine for a couple of years without any BSOD, so I didn't suspect it was causing this.
test it on another PC, to get familiar with the setup
ASKER
Nobus, are you suggesting testing the bug check tool or RamDisk on another computer? I have had RamDisk on another computer, as well as this one, for a couple of years, without difficulty. I tested the bug check tool on the other computer, and it didn't produce the report which both experts posted here.
i never used the word "ramdisk"
i suggest only to test windbg on another PC
i suggest only to test windbg on another PC
ASKER
Thank you. I tested windbg on another PC, with the same result as on this PC. No bugcheck, only the preliminary lines of information, appears in the console.
then you did not install it properly imo.
did you install the standalone version, or as part of WDK?
did you install the standalone version, or as part of WDK?
ASKER
The version which I installed gave a choice of which components to install. It was called SDK for Windows 7 and .NET Framework 4. I selected "Common Utilities>Debugging Tools for Windows." That produced an installer, dbg x86.msi, which I executed.
strange. i never had such problem; unless you have other provblems with the hard- or software?
ASKER
Input from all participating Experts is appreciated. If the issue persists, I'll try replacing the RAM. I've held off on that because a second Mem86 test was, again, negative for errors, and at the moment I am not seeing BSOD.
ASKER