ASP.net Dynamically building a Chart using a GridView
Hi
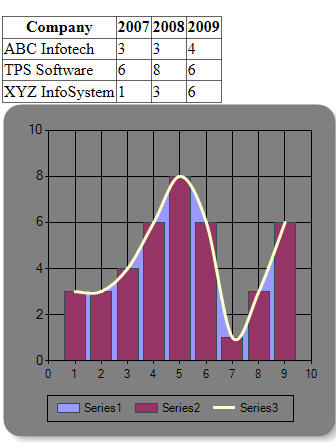
I am trying to build the chart from the GridView shown in the image dynamically
using the VB.net code below.
How do I add the Company names and years to the X axis
Sub oChart(ByVal RowFields As String, ByVal DataField As String, ByVal sAggregate As String, ByVal ColumnFields As String, oChartID As String, ByVal oRow As Integer, ByVal oColumn As Integer, ByVal blnShow_Data_With_Chart As Boolean)
' Initialize the Chart object
Dim chart1 As New Chart()
'chart1.ID = "chart1"
'Add to do code here
If Not IsPostBack Then
' Initialize objects and elements
Dim chartArea1 As New ChartArea()
Dim legend1 As New Legend()
Dim series1 As New Series()
Dim series2 As New Series()
Dim series3 As New Series()
' Set the Chart Properties
chart1.Width = 340
chart1.Height = 340
chart1.Palette = ChartColorPalette.EarthTon
chart1.Palette = ChartColorPalette.Excel
chart1.BackColor = System.Drawing.Color.Gray
chart1.BorderSkin.SkinStyl
chart1.BorderlineColor = System.Drawing.Color.Gray
chart1.BorderlineDashStyle
chart1.BorderlineWidth = 4
' Set the ChartArea properties
chartArea1.Name = "Default"
chartArea1.BackColor = System.Drawing.Color.Gray
'Enable AJAX features such as zooming and scrolling for the ChartArea
'chartArea1.CursorX.UserEn
'chartArea1.CursorY.UserEn
'chartArea1
' Add the ChartArea to the Chart
chart1.ChartAreas.Add(char
' Set the Legend properties
legend1.Name = "Default"
legend1.Docking = Docking.Bottom
legend1.LegendStyle = LegendStyle.Row
legend1.Alignment = System.Drawing.StringAlign
legend1.BackColor = System.Drawing.Color.Trans
legend1.BorderColor = System.Drawing.Color.Black
legend1.BorderWidth = 1
' Add the Legend to the Chart
chart1.Legends.Add(legend1
' Set the Series properties
series1.BorderColor = System.Drawing.Color.DarkS
series1.Name = "Series1"
series1.ChartType = SeriesChartType.SplineArea
series2.BorderColor = System.Drawing.Color.DarkS
series2.Name = "Series2"
series2.ChartType = SeriesChartType.Column
series3.Name = "Series3"
series3.BorderWidth = 3
series3.ChartType = SeriesChartType.Spline
' Add the Series to the Chart
chart1.Series.Add(series1)
chart1.Series.Add(series2)
chart1.Series.Add(series3)
' Add points to each series.
Dim rnd As New Random()
'For Each ser As Series In chart1.Series
'For i As Integer = 0 To 12
'ser.Points.AddY(rnd.[Next
'Next
'Next
'chart1.DataSource = dt
'chart1.DataBind()
'GridView1.DataSource = dt
'GridView1.DataBind()
Dim oGridView As New GridView
'oGridView.DataSource = dt
'First get the Aggregate function
Dim oAggregate As AggregateFunction
If sAggregate = "Count" Then
oAggregate = AggregateFunction.Count
ElseIf sAggregate = "Sum" Then
oAggregate = AggregateFunction.Sum
ElseIf sAggregate = "First" Then
oAggregate = AggregateFunction.First
ElseIf sAggregate = "Last" Then
oAggregate = AggregateFunction.Last
ElseIf sAggregate = "Average" Then
oAggregate = AggregateFunction.Average
ElseIf sAggregate = "Max" Then
oAggregate = AggregateFunction.Max
ElseIf sAggregate = "Min" Then
oAggregate = AggregateFunction.Min
ElseIf sAggregate = "Exists" Then
oAggregate = AggregateFunction.Exists
End If
Dim dt As DataTable = ExcelLayer.GetDataTable("_
Dim pvt As New Pivot(dt)
oGridView.DataSource = pvt.PivotData(RowFields, DataField, oAggregate, ColumnFields)
oGridView.DataBind()
Me.Table1.Rows(oRow).Cells
oGridView.Visible = True
' MsgBox(oGridView.Rows(0).C
Dim oData As Double
'SO LOOP THROUGH ALL THE NUMERIC CELLS AND PLOT ON A CHART
For Each ser As Series In chart1.Series
'ser.Label = ser.Name
For r As Integer = 0 To oGridView.Rows.Count - 1
For c As Integer = 1 To oGridView.Rows(0).Cells.Co
'only add a point if the item is numeric
If IsNumeric(oGridView.Rows(r
oData = CDbl(oGridView.Rows(r).Cel
'ser.Points.Add(oData)
ser.Points.AddY(oData)
End If
Next
Next
Next
Me.Table1.Rows(oRow).Cells
'Only show GridView if specified
If blnShow_Data_With_Chart = True Then
oGridView.Visible = True
End If
'Preserve the chart's state during callbacks
End If
End Sub
ASKER CERTIFIED SOLUTION
membership
This solution is only available to members.
To access this solution, you must be a member of Experts Exchange.
ASKER