leblanc
asked on
MS Project 2013 Milestone report
Can you explain the chart (see attached) on the right side of the milestone report? What does the y-axix represent ? 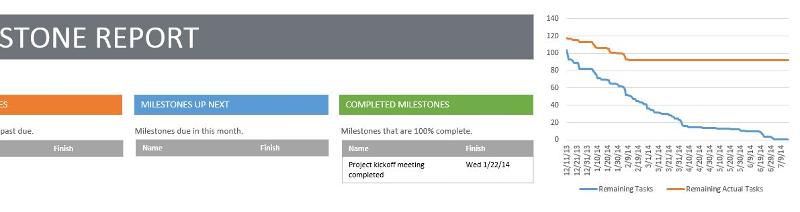

ASKER CERTIFIED SOLUTION
membership
This solution is only available to members.
To access this solution, you must be a member of Experts Exchange.
SOLUTION
membership
This solution is only available to members.
To access this solution, you must be a member of Experts Exchange.
ASKER
I see so with time, obviously, those tasks will decrease. That makes sense.
ASKER