I need to extract a polynomial equation from results
I have a table of values that provide volume of a cone based on a diameter measurement at the 1.3 meter height mark (volume of an evergreen tree). The creator of the table is long gone and the equation used is too. I do not have the skills to rebuild it and hope a math expert can do it for me and help solve my dilemma.
I do not have a lot to go on so some 'guess work' may be involved.
Here is a list of what I have: Diameter in centimeters and volume in cubic meters. What do I do to expand/extrapolate to 62 cm diameter to get a somewhat accurate volume?
d(cm) vol(m3)
10 0.013
12 0.027
14 0.044
16 0.064
18 0.089
20 0.118
22 0.153
24 0.193
26 0.239
28 0.290
30 0.348
32 0.416
34 0.488
36 0.572
38 0.660
40 0.761
42 0.866
44 0.980
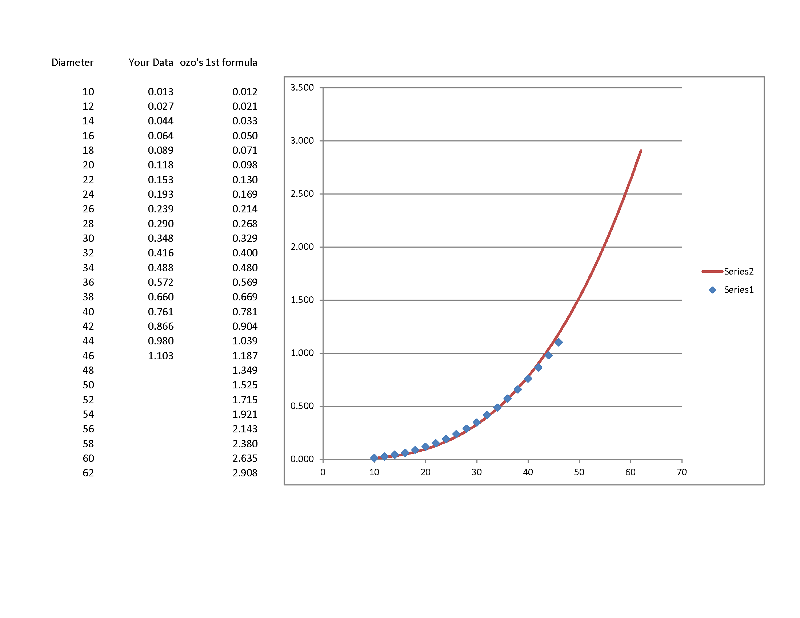
46 1.103
48 X
50 X
52 X
...
62 X
Thanks for any help that you can provide.
I do not have a lot to go on so some 'guess work' may be involved.
Here is a list of what I have: Diameter in centimeters and volume in cubic meters. What do I do to expand/extrapolate to 62 cm diameter to get a somewhat accurate volume?
d(cm) vol(m3)
10 0.013
12 0.027
14 0.044
16 0.064
18 0.089
20 0.118
22 0.153
24 0.193
26 0.239
28 0.290
30 0.348
32 0.416
34 0.488
36 0.572
38 0.660
40 0.761
42 0.866
44 0.980
46 1.103
48 X
50 X
52 X
...
62 X
Thanks for any help that you can provide.
ozo
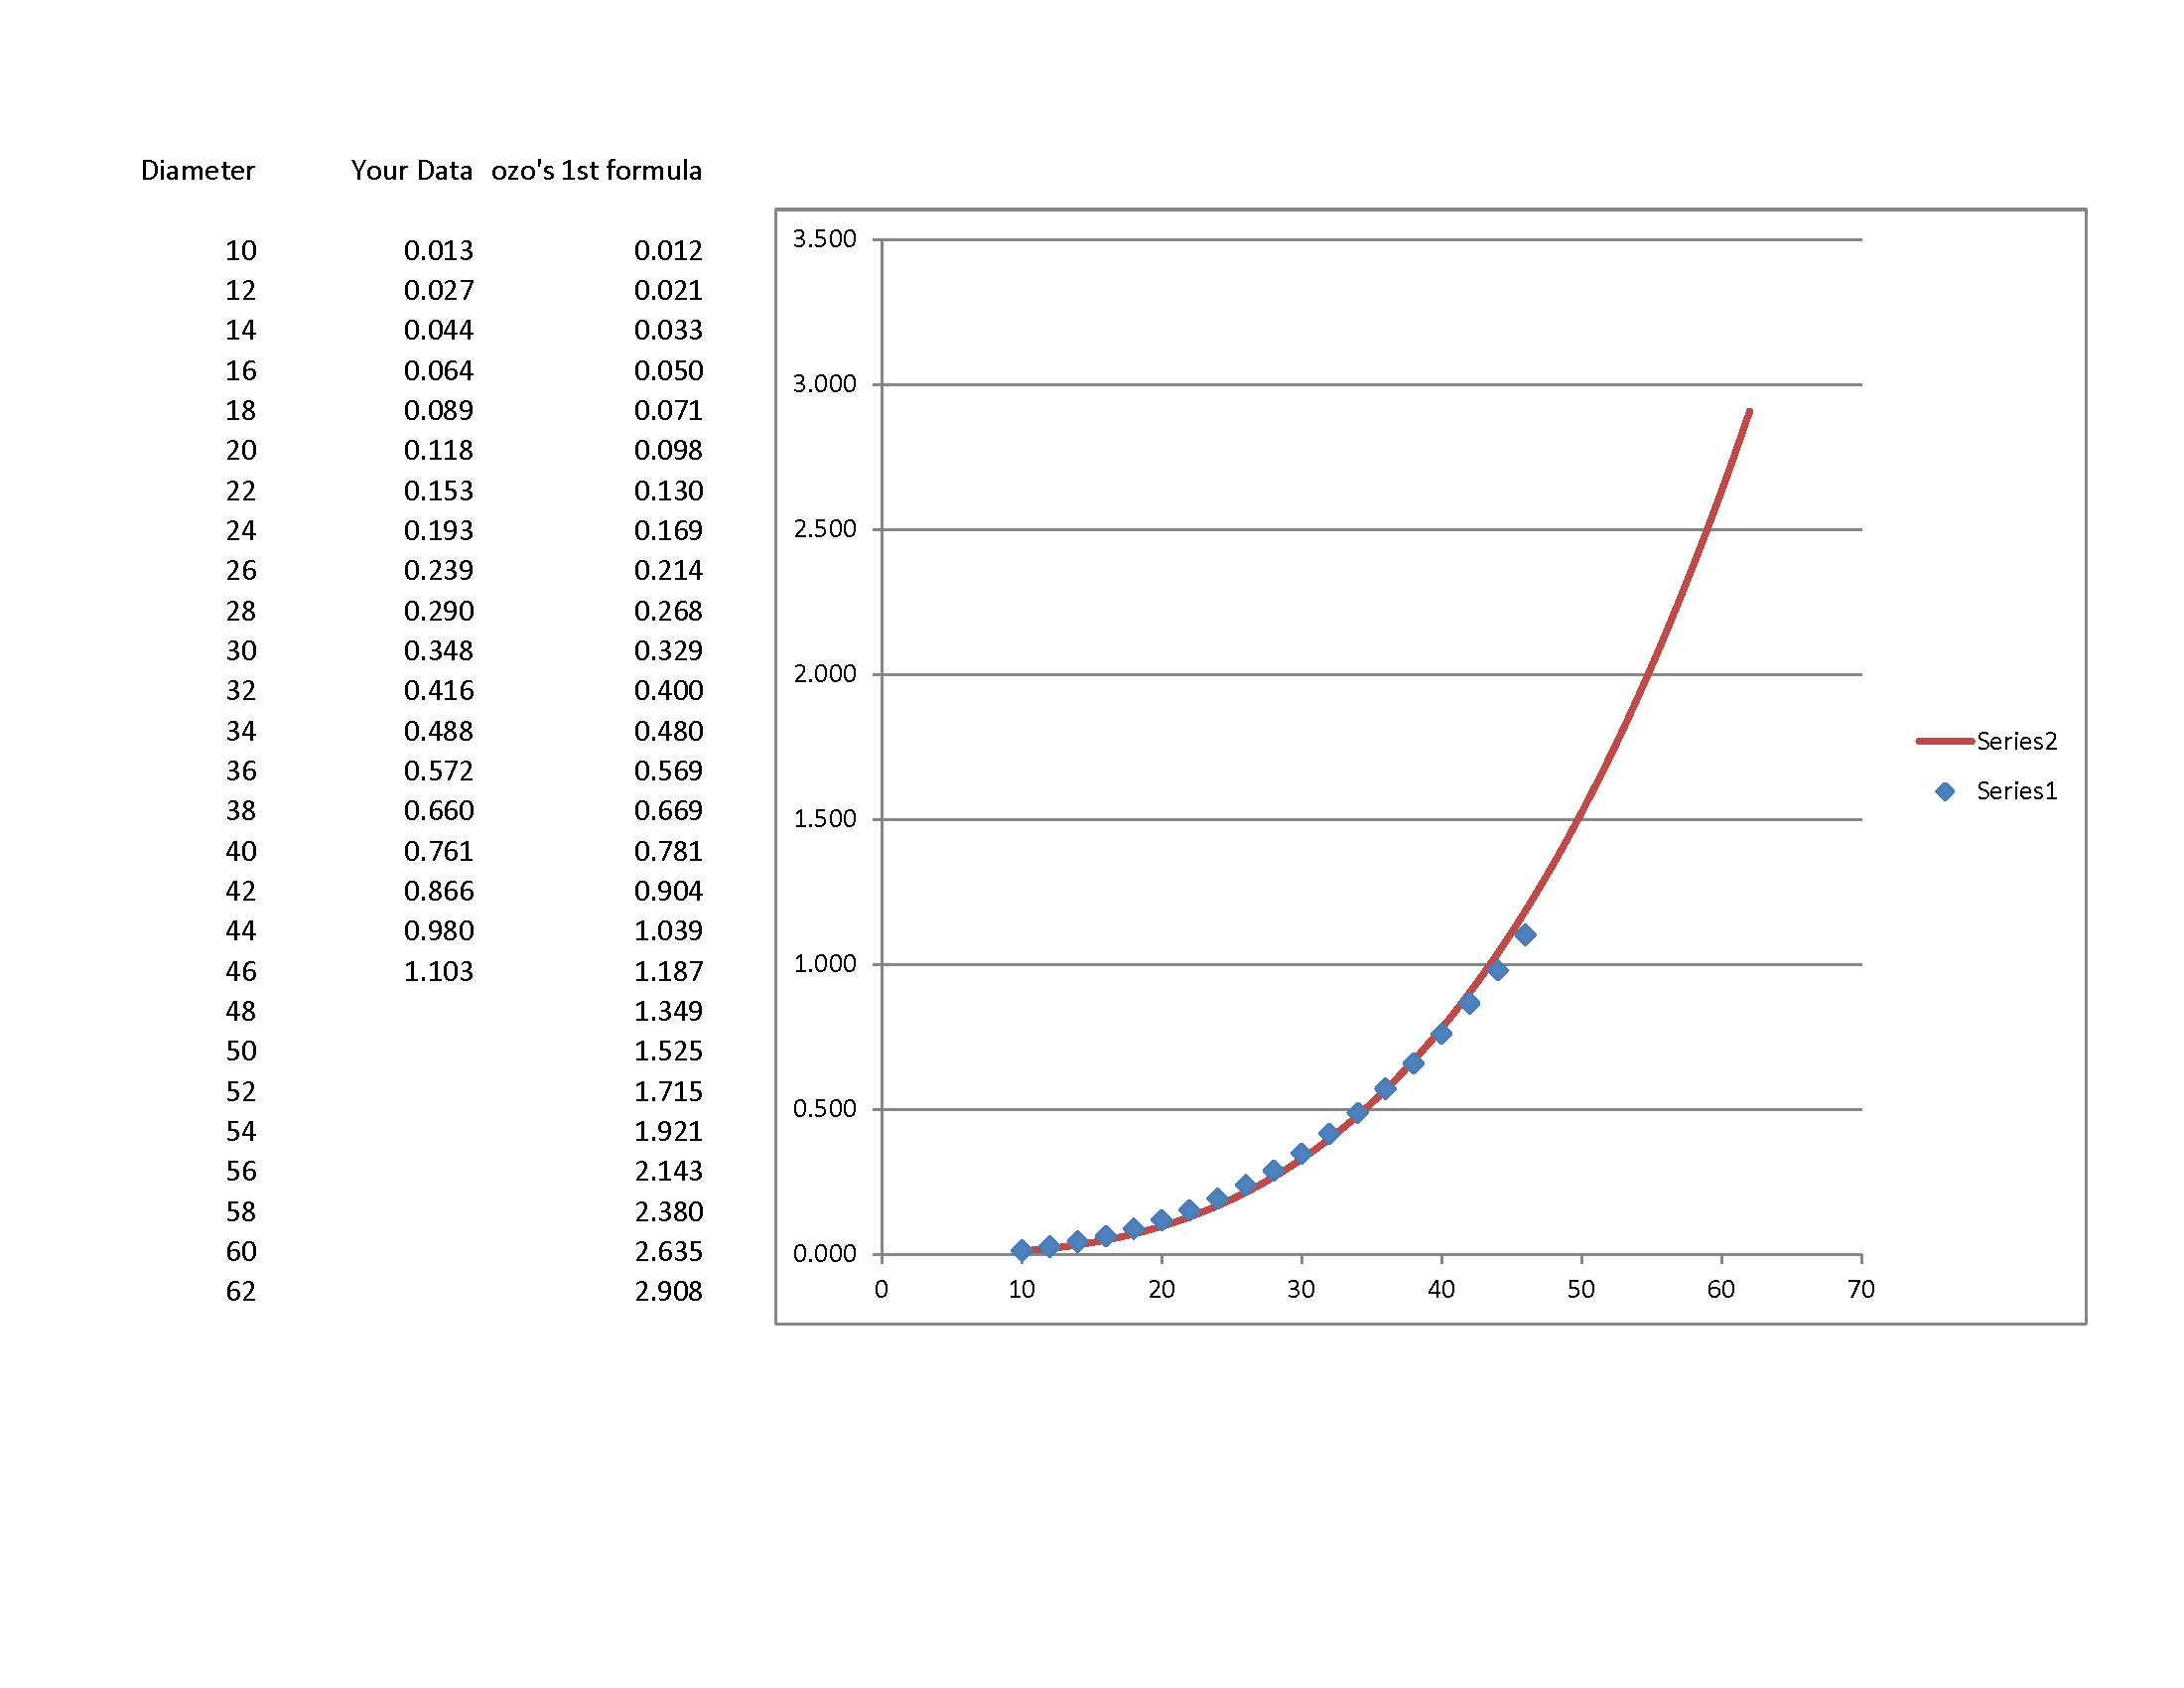
looks like vol=d^3*x where 1.1e-5<x<1.6e-5 with a mean around 1.22e-5
ASKER
Can you dumb it down a bit for me. I need to learn how you did this because I have a bunch more tables to process. I think it can be best described by a 7th order polynomial.
Please provide an example or two to fill in missing values in my example.
Thanks.
Please provide an example or two to fill in missing values in my example.
Thanks.
ASKER CERTIFIED SOLUTION
membership
This solution is only available to members.
To access this solution, you must be a member of Experts Exchange.
a 7th order polynomial seems to be overfit for only 19 points and no more than 2 significant digits for d and 4 significant digits for vol
even a 3rd order polynomial seems to be too many degrees of freedom for the noise in the data
even a 3rd order polynomial seems to be too many degrees of freedom for the noise in the data
ASKER
I guessed at 7
ASKER
I have no idea how you arrived at the equation but it works close enough for me. I have at a collection of tables that will each have their own unique polynomial equation. I can post them all separately or in one question or you provide me the method that you used to construct the equation.
The 'noise' that you refer to is nature and its randomness.
If interested how do you want to proceed?
The 'noise' that you refer to is nature and its randomness.
If interested how do you want to proceed?
Here is a plot of your data and ozo's first formula:
It might help if you could provide a drawing of the volume you are trying to calculate.
The volume values do not seem consistent with the height and diameters you have shown.
It might help if you could provide a drawing of the volume you are trying to calculate.
The volume values do not seem consistent with the height and diameters you have shown.
ASKER
@ d-glitch the values provided are from real world data (hence the noise). It is based on taking thousands of samples over years and then coming up with an average volume based on diameter.
Problem is they stopped at 46 cm and all of the parties involved are either dead or retired. I need to project the volumes up to an including 62 cm. I took this on because no one else wood. The graph you provided is accurate for my purposes as no one wants to spend the time nor money to conduct sampling to dial in the volumes more accurately.
Problem is they stopped at 46 cm and all of the parties involved are either dead or retired. I need to project the volumes up to an including 62 cm. I took this on because no one else wood. The graph you provided is accurate for my purposes as no one wants to spend the time nor money to conduct sampling to dial in the volumes more accurately.
ASKER
my spelling is atrocious
ASKER
Now factor in that each table represent different tree species and different height classes.
If I could learn how to derive the polynomials based on the results tables then I can work on my own to figure this out and quit bothering you guys.
Of course I will post each table in a separate question if that is the proper procedure on here.
If I could learn how to derive the polynomials based on the results tables then I can work on my own to figure this out and quit bothering you guys.
Of course I will post each table in a separate question if that is the proper procedure on here.
ASKER
I figured it out using excel. Thanks for all of the help!
http:#a40350598 was a least square polynomial fit http://mathworld.wolfram.com/LeastSquaresFittingPolynomial.html
http:#a40350536 was an eyeball approximation for d^3*x, which seemed reasonable as a relationship between a length and a volume.
Without a lot more data to a lot more precision, I wouldn't try to go to 7th order, since trying to fit all the little wiggles caused by random variation would likely produce a formula too ideosyncratic to trust to be generalizable anywhere other than on the points in the input data.
If some of the points were generated from averaging more measurements than other points, you could weight them more heavily in the polynomial fit.
You might get a rough idea of how consistent an extrapolation to d=62 would be for a given fitting procedure by varying the last significant digits in your data and seeing how much that changes the resulting polynomial and the extrapolated value at extreme d
I note that you spelled "would" as "wood" which is appropriate for this question
-
ozo's comment
"Without a lot more data to a lot more precision, I wouldn't try to go to 7th order, since trying to fit all the little wiggles caused by random variation would likely produce a formula too ideosyncratic to trust to be generalizable anywhere other than on the points in the input data. "
is VERY appropriate.
The more terms you put in the polynomial, the more an extrapolation is uncertain.
You indicate you want an extrapolation.
Excel is a good program. Put you data in it and ask it to fit a 2nd degree polynomial.
It will do so and will probably be good enough. Try a third if you want. Seven is much too much
ASKER
I went with 2nd degree. It works good enough and it is easier on the head as I now discovered approximately 50 tables to extrapolate. ARRGH!
Thanks everyone.
Thanks everyone.