holemania
asked on
SQL - Running Value
I created a sql query to calculate a running value to calculate shortage. However, I can't seem to get it to work correctly.
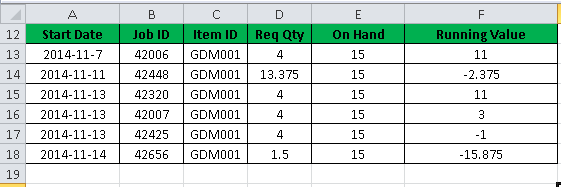
This is what I'm expecting. The RunningValue column is what I'm after.
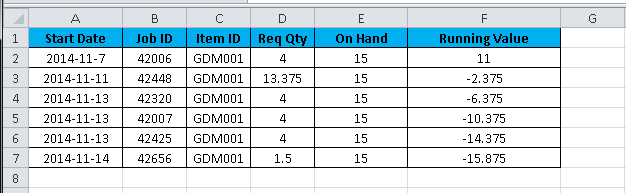
However, I'm getting the following instead with my current SQL Query.
Here's my sql script. Maybe I'm not doing something right.
This is what I'm expecting. The RunningValue column is what I'm after.
However, I'm getting the following instead with my current SQL Query.
Here's my sql script. Maybe I'm not doing something right.
SELECT	J.START_DATE, J.JOB_ID, J.ITEM_ID, J.REQ_QTY, J.ON_HAND,

		(
		SELECT	MAX(J2.ON_HAND) - SUM(J2.REQ_QTY)
		FROM	JOB_ORDER J2
		WHERE	J2.ITEM_ID = J.ITEM_ID
				AND J2.START_DATE <= J.START_DATE
				AND J2.JOB_ID <= J.JOB_ID
		)

FROM	JOB_ORDER J
WHERE	J.ITEM_ID = 'GDM001'
AND J.START_DATE BETWEEN '2014-11-7' AND '2014-11-14'| START_DATE | JOB_ID | ITEM_ID | REQ_QTY | ON_HAND | PREV_QTY | COLUMN_6 |
|--------------|--------|---------|---------|---------|----------|----------|
| Nov, 07 2014 | 42006 | GDM001 | 4 | 15 | 4 | 11 |
| Nov, 11 2014 | 42448 | GDM001 | 13.375 | 15 | 17.375 | -2.375 |
| Nov, 13 2014 | 42350 | GDM001 | 4 | 15 | 29.375 | -14.375 |
| Nov, 13 2014 | 42007 | GDM001 | 4 | 15 | 29.375 | -14.375 |
| Nov, 13 2014 | 42424 | GDM001 | 4 | 15 | 29.375 | -14.375 |
| Nov, 14 2014 | 42656 | GDM001 | 1.5 | 15 | 30.875 | -15.875 |SELECT
J.START_DATE
, J.JOB_ID
, J.ITEM_ID
, J.REQ_QTY
, J.ON_HAND
, CA.PREV_QTY
, J.ON_HAND - CA.PREV_QTY
FROM JOB_ORDER J
CROSS APPLY (
SELECT
SUM(J2.REQ_QTY)
FROM JOB_ORDER J2
WHERE J2.ITEM_ID = J.ITEM_ID
AND J2.START_DATE <= J.START_DATE
) CA (PREV_QTY)
WHERE J.ITEM_ID = 'GDM001'
AND ( J.START_DATE >= '20141107' AND J.START_DATE < '20141115' )
;CREATE TABLE JOB_ORDER
([Start_Date] datetime, [Job_ID] int, [Item_ID] varchar(6), [Req_Qty] decimal(12,3), [On_Hand] decimal(12,3))
;
INSERT INTO JOB_ORDER
([Start_Date], [Job_ID], [Item_ID], [Req_Qty], [On_Hand])
VALUES
('2014-11-07 00:00:00', 42006, 'GDM001', 4, 15),
('2014-11-11 00:00:00', 42448, 'GDM001', 13.375, 15),
('2014-11-13 00:00:00', 42350, 'GDM001', 4, 15),
('2014-11-13 00:00:00', 42007, 'GDM001', 4, 15),
('2014-11-13 00:00:00', 42424, 'GDM001', 4, 15),
('2014-11-14 00:00:00', 42656, 'GDM001', 1.5, 15)
;see it working at: http://sqlfiddle.com/#!3/f77db5/1
Please note I have altered the method used for the date range filter.
See: "Beware of Between"
and the safest date literal in SQL Server is YYYYMMDD
ASKER
Thanks PortletPaul.
Anyway to get it so that the running value as followed:
Seems to repeat -14.375 since the date is the same. However, I also need it to sum correctly for each line.
Anyway to get it so that the running value as followed:
|   START_DATE | JOB_ID | ITEM_ID | REQ_QTY | ON_HAND | PREV_QTY | COLUMN_6 |
|--------------|--------|---------|---------|---------|----------|----------|
| Nov, 07 2014 |  42006 |  GDM001 |       4 |      15 |        4 |       11 |
| Nov, 11 2014 |  42448 |  GDM001 |  13.375 |      15 |   17.375 |   -2.375 |
| Nov, 13 2014 |  42350 |  GDM001 |       4 |      15 |   29.375 |  -6.375 |
| Nov, 13 2014 |  42007 |  GDM001 |       4 |      15 |   29.375 |  -10.375 |
| Nov, 13 2014 |  42424 |  GDM001 |       4 |      15 |   29.375 |  -14.375 |
| Nov, 14 2014 | 42656 | GDM001 | 1.5 | 15 | 30.875 | -15.875 |Seems to repeat -14.375 since the date is the same. However, I also need it to sum correctly for each line.
ASKER
Looks like the following works, but only with SQL 2012. Unfortunately, that's only my test environment and all my production SSRS reports as well as databases are on SQL 2005 and 2008.
The above produce the result I need.
DECLARE @SPOUTPUT TABLE(
		START_DATE DATE,
		JOB_ID VARCHAR(30),
		ITEM_ID VARCHAR(30),
		REQ_QTY DECIMAL(15, 4),
		ON_HAND DECIMAL(15, 4)
		)

INSERT INTO @SPOUTPUT
VALUES('2014-11-7', '42006', 'GDM001', '4', '15')
INSERT INTO @SPOUTPUT
VALUES('2014-11-11', '42448', 'GDM001', '13.375', '15')
INSERT INTO @SPOUTPUT
VALUES('2014-11-13', '41320', 'GDM001', '4', '15')
INSERT INTO @SPOUTPUT
VALUES('2014-11-13', '42007', 'GDM001', '4', '15')
INSERT INTO @SPOUTPUT
VALUES('2014-11-13', '42425', 'GDM001', '4', '15')
INSERT INTO @SPOUTPUT
VALUES('2014-11-14', '42656', 'GDM001', '1.5', '15')

SELECT	S.START_DATE, S.JOB_ID, S.ITEM_ID, S.REQ_QTY, S.ON_HAND,
		S.ON_HAND - SUM(S.REQ_QTY) OVER (PARTITION BY S.ITEM_ID ORDER BY S.START_DATE, S.JOB_ID)
FROM	@SPOUTPUT S
ORDER BY S.START_DATE, S.JOB_IDThe above produce the result I need.
START_DATE JOB_ID                         ITEM_ID                        REQ_QTY                                 ON_HAND                                 RUNNING_VALUE
---------- ------------------------------ ------------------------------ --------------------------------------- --------------------------------------- ---------------------------------------
2014-11-07 42006                          GDM001                         4.0000                                  15.0000                                 11.0000
2014-11-11 42448                          GDM001                         13.3750                                 15.0000                                 -2.3750
2014-11-13 41320                          GDM001                         4.0000                                  15.0000                                 -6.3750
2014-11-13 42007                          GDM001                         4.0000                                  15.0000                                 -10.3750
2014-11-13 42425                          GDM001                         4.0000                                  15.0000                                 -14.3750
2014-11-14 42656                          GDM001                         1.5000                                  15.0000                                 -15.8750
"Sum correctly for each line"
Exactly how do you decide what is correct? That isn't stated.
Exactly how do you decide what is correct? That isn't stated.
ASKER CERTIFIED SOLUTION
membership
This solution is only available to members.
To access this solution, you must be a member of Experts Exchange.
ASKER
Awesome. Thank you.
Using Max() probably does not do what you want. That's because the quantity on hand (QOH) will fluctuate as orders are processed.
On a related note, the source data looks odd. It would be odd for orders to be unprocessed for a week, and for the QOH to remain the same for an entire week.
Also, your data is not sorted by the Job ID. That will make the Running Values misleading, even when they are being evaluated correctly.