jQplot Bar chart tick value
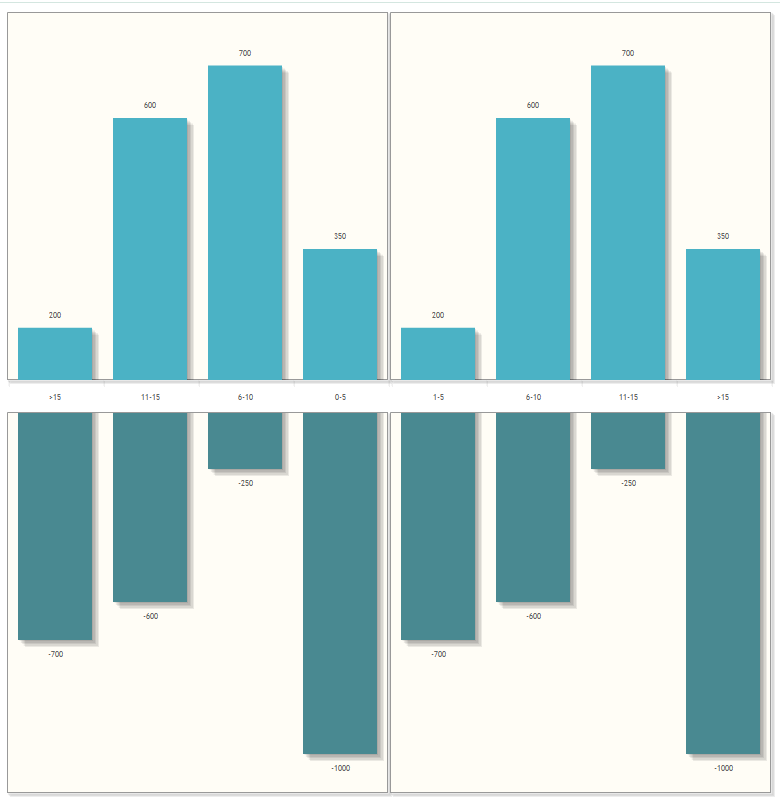
I am using jqPlot to create a 4 quadrant chart. Is there anyway I can make the 2 bottom charts show positive numbers. I don't need the negative symbol in what I am trying to do.
Any help/suggestion will be appreciated.
Thanks!
Any help/suggestion will be appreciated.
Thanks!
ASKER
I want to display the negative number without the minus. is that possible?
ASKER
Here's the HTML code:
Here's the javascript code:
<style>
#testTarget2, #testTarget4, #testTarget, #testTarget3{
	width:400px;
	height:400px;
}
#testTarget2, #testTarget4, #testTarget, #testTarget3{
float: left;
}
#testTarget {
clear: left;
}
}
</style>
  <div id="testTarget2" style="width:400px; height:400px;"></div>
  <div id="testTarget4" style="width:400px; height:400px;margin-left:-17px"></div>

  <div id="testTarget" style="width:400px; height:400px;"></div>
<div id="testTarget3" style="width:400px; height:400px;margin-left:-17px"></div>Here's the javascript code:
//------------------------------------------Quadrant 1 (Top Left)
    var s2 = [200, 600, 700, 350];
    var ticks = ['>15', '11-15', '6-10', '0-5'];
    var plot2 = $.jqplot('testTarget2', [s2], {
        seriesDefaults:{
            renderer:$.jqplot.BarRenderer,
            rendererOptions: {fillToZero: true},
             pointLabels: {show: true}
        },
        series:[
            {label:'Airfare'}
        ],
            axesDefaults: {
        		showTicks: true,
        		showTickMarks: true
    	},

        axes: {
            // Use a category axis on the x axis and use our custom ticks.
            xaxis: {
                renderer: $.jqplot.CategoryAxisRenderer,
                ticks: ticks,
                showTicks: true,
        		showTickMarks: true

            },
            // Pad the y axis just a little so bars can get close to, but
            // not touch, the grid boundaries.  1.2 is the default padding.
            yaxis: {
                pad: 1.05,
                //tickOptions: {formatString: '$%d'},
                showTicks: false,
        		showTickMarks: false
            }
        }
    });


//------------------------------------------Quadrant 2 (Top Right)
    var s4 = [95, 150, 135, 175];
    var ticks = ['1-5', '6-10', '11-15', '>15'];

    var plot4 = $.jqplot('testTarget4', [s4], {
        // The "seriesDefaults" option is an options object that will
        // be applied to all series in the chart.
        seriesDefaults:{
            renderer:$.jqplot.BarRenderer,
            rendererOptions: {fillToZero: true},
             pointLabels: {show: true}
        },
        series:[
            {label:'Airfare'}
        ],
            axesDefaults: {
        		showTicks: true,
        		showTickMarks: true
    	},

        axes: {
            // Use a category axis on the x axis and use our custom ticks.
            xaxis: {
                renderer: $.jqplot.CategoryAxisRenderer,
                ticks: ticks,        		showTicks: true,
        		showTickMarks: true
            },
            // Pad the y axis just a little so bars can get close to, but
            // not touch, the grid boundaries.  1.2 is the default padding.
            yaxis: {
                pad: 1.05,
                //tickOptions: {formatString: '$%d'},
                     // same options as axesDefaults
	            showTicks: false,        // wether or not to show the tick labels,
	            showTickMarks: false    // wether or not to show the tick marks

            }
        }
    });


//Quadrant 3 (Bottom left)
    var s1 = [-250, -350, -150, -500];
    var ticks = ['May', 'June', 'July', 'August'];

    var plot1 = $.jqplot('testTarget', [s1], {
        // The "seriesDefaults" option is an options object that will
        // be applied to all series in the chart.
        seriesDefaults:{
            renderer:$.jqplot.BarRenderer,
            rendererOptions: {fillToZero: true},
             pointLabels: {show: true}
        },

        series:[

            {label:'Airfare'}
        ],
            axesDefaults: {
        showTicks: false,
        showTickMarks: false
    },

        axes: {
            // Use a category axis on the x axis and use our custom ticks.
            xaxis: {
                renderer: $.jqplot.CategoryAxisRenderer,
                ticks: ticks
            },

        }
    });


//------------------------------------------Quadrant 4 (bottom right)
 var s3 = [-700, -600, -250, -175];
    var plot3 = $.jqplot('testTarget3', [s3], {
        seriesDefaults:{
            renderer:$.jqplot.BarRenderer,
            rendererOptions: {fillToZero: true},
             pointLabels: {show: true}
        },
        series:[
            {label:'Airfare'}
        ],
            axesDefaults: {
        showTicks: false,
        showTickMarks: false
    },

        axes: {
            // Use a category axis on the x axis and use our custom ticks.
            xaxis: {
                renderer: $.jqplot.CategoryAxisRenderer,
                ticks: ticks
            }
        }
});ASKER
ASKER CERTIFIED SOLUTION
membership
This solution is only available to members.
To access this solution, you must be a member of Experts Exchange.
Do you mean you want to display negative number without the minus -
or you want to display other values (positive value)?