Excel Charts - Gantt Chart with Current Date Line
I'm trying to create a Gantt chart in Excel that will show a vertical line indicating the current (today's) date. I have most of the construction down, including "padding" columns, but need help resolving one final issue.
The "today line" is broken (hidden) when occurring before an event. It's covered by the series that pads the events to their correct starting date. I made the series white with no borders and also tried no fill, but it covers it anyway.
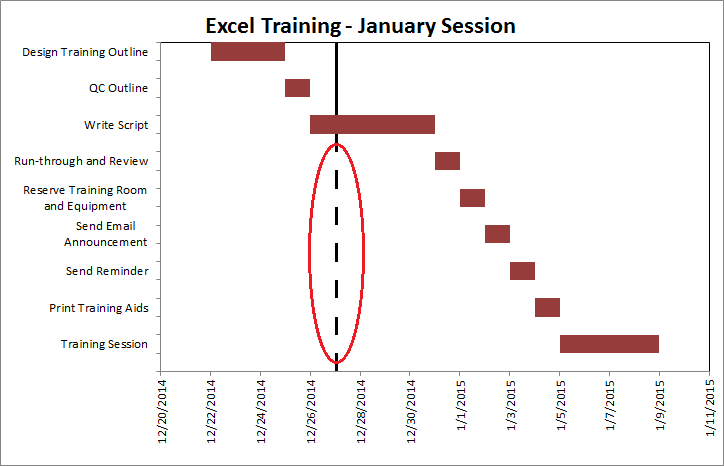
I know intuitively that the series that pads the dates will need to be further broken up, but darn if I can get my head around it. Hopefully, an expert here can get me pointed in the right direction. See the attached file.
With Thanks,
-Glenn
Gantt-Chart---Horizontal-Bars.xlsx
The "today line" is broken (hidden) when occurring before an event. It's covered by the series that pads the events to their correct starting date. I made the series white with no borders and also tried no fill, but it covers it anyway.
I know intuitively that the series that pads the dates will need to be further broken up, but darn if I can get my head around it. Hopefully, an expert here can get me pointed in the right direction. See the attached file.
With Thanks,
-Glenn
Gantt-Chart---Horizontal-Bars.xlsx
ASKER CERTIFIED SOLUTION
membership
This solution is only available to members.
To access this solution, you must be a member of Experts Exchange.
ASKER
Fantastic and ingenious combination of chart types to resolve this issue.
ASKER
I had tried to add a scatter chart, but had not tried the error bar approach. Also, after doing your steps manually, I see that the order of execution is very important.
Thanks for your great solution.
Regards,
-Glenn
Thanks for your great solution.
Regards,
-Glenn
Thanks for the grade and for the feedback.
I never use error bars for whatever they are meant to be used for. They can be a mean little addition to the charting trick box, though.
BTW, my first computing work was on a Pr1me super-mini. :-)) I wrote my thesis on a Pr1me system word processor and created all the analysis and charts on some charting software that ran on that "box". I had a student job and was responsible for the daily tape backup, so I was in and out of the computer room and up close and personal with the hardware. The system was living in a converted classroom and was the size of 10 to 12 shoulder-height fridges in a row.
My major was English and music, but I converted to IT after that learning experience. Never looked back.
1. The bars will always be stacked in the order that they are listed in the data source dialog.
2. There is no data in the source table for the future events. You use a formula to leave the cells blank. Even if there were data, it would result in the black narrow bar stacked on top of the red bar. (see 1.)
To create the illusion of one uninterrupted line, you could split the Start Date series into two series and insert another series between the two. The values for this series would be blank if in the past. That would be a very complex setup with many helper columns and calculations. It's possible, but a bit intense to set up.
Attached please find a file where this approach is on Sheet2.
cheers, teylyn
Gantt-Chart---Horizontal-Bars--1-.xlsx