Conditionally fill data series with another color based on month
Dear Experts:
A chart with figures for the last 12 months is depicted in the active worksheet
Every month the figure for the 'oldest' month is deleted and the figure for the latest month is added
The fill for the 2015 data series should be red, i.e. whenever a new month of the current year is added
the fill for that data point is to be filled red automatically, using a 'Worksheet_Change(ByVal)' macro
That is, every month a new red data point appears and a blue one is dropped.
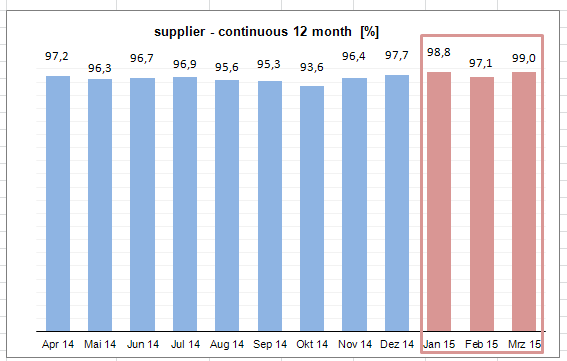
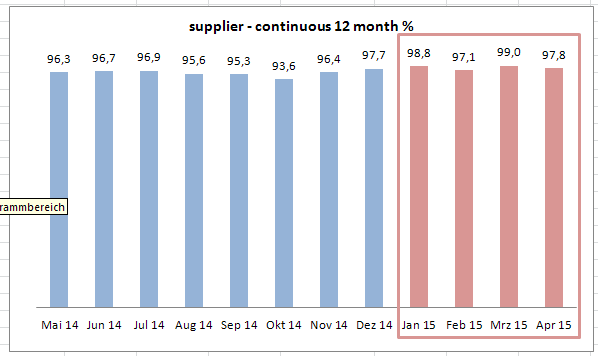
I have attached a sample file for your convenience.
Help is much appreciated. Thank you very much in advance.
Regards, Andreas
Data-Series-Color-Depending-on-month.xls
A chart with figures for the last 12 months is depicted in the active worksheet
Every month the figure for the 'oldest' month is deleted and the figure for the latest month is added
The fill for the 2015 data series should be red, i.e. whenever a new month of the current year is added
the fill for that data point is to be filled red automatically, using a 'Worksheet_Change(ByVal)' macro
That is, every month a new red data point appears and a blue one is dropped.
I have attached a sample file for your convenience.
Help is much appreciated. Thank you very much in advance.
Regards, Andreas
Data-Series-Color-Depending-on-month.xls
HI,
if the data comes automatically you could use OnOpen event instead of onChange
if the data comes automatically you could use OnOpen event instead of onChange
Sub Macro1()
'
' Macro1 Macro
'
    Dim DataArray() As Variant
'
    Set g = Sheets("Conditonal_Formatting").ChartObjects(1).Chart
    For Each col In g.SeriesCollection
        DataArray = col.XValues
        For Idx = 1 To col.Points.Count
            If Year(DataArray(Idx)) = Year(WorksheetFunction.Min(DataArray)) Then
                col.Points(Idx).Format.Fill.ForeColor.RGB = RGB(142, 180, 227)
            Else
                col.Points(Idx).Format.Fill.ForeColor.RGB = RGB(230, 185, 184)
            End If
        Next
    Next

End SubASKER
Hi Rgonzo,
thank you very much for your swift and professional support. Works great, thank you very much for it, but as a matter of fact I favor a macro solution on this question, i.e. I guess it will be a 'Worksheet_Change(ByVal)' macro solution, won't it?
Thank you very much in advance. Regards, Andreas
thank you very much for your swift and professional support. Works great, thank you very much for it, but as a matter of fact I favor a macro solution on this question, i.e. I guess it will be a 'Worksheet_Change(ByVal)' macro solution, won't it?
Thank you very much in advance. Regards, Andreas
ASKER CERTIFIED SOLUTION
membership
This solution is only available to members.
To access this solution, you must be a member of Experts Exchange.
No Points for this small changes in Rgonzo code to do what you are looking for.. I have assumed that the last series will be the one which you want to highlight red as that will be previous year one for sure...
Saurabh...
Private Sub Worksheet_Change(ByVal Target As Range)
    Dim DataArray() As Variant
    '
    Set g = Sheets(Target.Parent.Name).ChartObjects(1).Chart
    For Each col In g.SeriesCollection
        DataArray = col.XValues
        For Idx = 1 To col.Points.Count
            If Year(DataArray(Idx)) = Year(WorksheetFunction.Min(DataArray)) Then
                Set pt = col.Points(Idx)
                col.Points(Idx).Format.Fill.ForeColor.RGB = RGB(142, 180, 227)
            Else
                If Idx = col.Points.Count Then
                    col.Points(Idx).Format.Fill.ForeColor.RGB = RGB(255, 0, 0)
                Else
                    col.Points(Idx).Format.Fill.ForeColor.RGB = RGB(230, 185, 184)
                End If
            End If
        Next
    Next

End SubSaurabh...
ASKER
Dear both,
thank you so much for your help. Will do some testing tonite and then let you know. Regards, Andreas
thank you so much for your help. Will do some testing tonite and then let you know. Regards, Andreas
ASKER
Just checked it, I am again very, very impressed by your expertise. Thank you very much for your great and professional support.
As a matter of fact, I could use both codes.
Regards, Andreas
As a matter of fact, I could use both codes.
Regards, Andreas
ASKER
Rgonzo, if you do not mind, although Saurabh does not want any points for his contribution, I would like to split the points, 400:100, would that be ok for you?
Regards, Andreas
Regards, Andreas
Hi Andreas,
I didn't posted for points..feel free to allocate all the points to Rgonzo as i just tweaked his code only a bit basis of your need..
Saurabh...
I didn't posted for points..feel free to allocate all the points to Rgonzo as i just tweaked his code only a bit basis of your need..
Saurabh...
ASKER
Okay, thank you saurabh, very kind, I will do what you want. Again, thank you very much for your great and professional support. Regards, Andreas
ASKER
Great coding, thank you very much for it
Are you sure to want a macro and not formulas see example
Regards
EE20150410.xlsm