AckeemK
asked on
Pivot Tables to capture blanks but not display them
I am looking to edit my pivot tables in the 'Open SR Pivots' tab and 'Closed SR Pivots' tab to capture the blanks but not display them in the charts in the 'Charts of SRs' tab. Essentially for each of the pivots, I want to capture about 10 blank fields down in case more information is added to the data source so it is captured when the data is refreshed on the charts. However, every time I try to do so, it displays the blanks on the charts.
DSE-Carelog-Report.xlsm
DSE-Carelog-Report.xlsm
check it is fixed now.
DSE-Carelog-Report.xlsm
DSE-Carelog-Report.xlsm
ASKER
Hi Saurabh,
I showed an example of adding in more values and the pivot not capturing it. Anyway to fix this? I want to add in those blank cells underneath to auto adjust as you mention but currently it is not doing so.
I showed an example of adding in more values and the pivot not capturing it. Anyway to fix this? I want to add in those blank cells underneath to auto adjust as you mention but currently it is not doing so.
ASKER
I have attached your file back here.
DSE-Carelog-Report--6-.xlsm
DSE-Carelog-Report--6-.xlsm
AckeemK,
I don't exactly follow what's your problem..?? If you add the new data and refresh the pivot table it will show additional data automatically but you need to do refresh manually...
Saurabh...
I don't exactly follow what's your problem..?? If you add the new data and refresh the pivot table it will show additional data automatically but you need to do refresh manually...
Saurabh...
ASKER
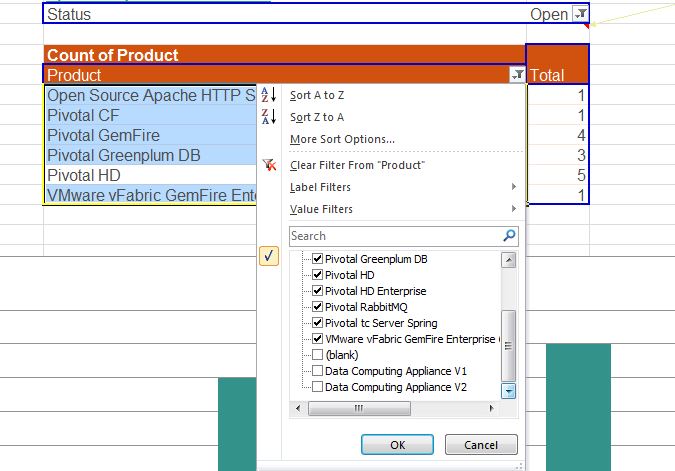
If you notice, the Data Computing Appliance V1 and V2 even after refreshing is not in the chart.
Yeah because you have unchecked them in the pivot table..Enclosed is the snapshot of the same for your reference..Once you check them it will automatically show...
ASKER
Attached is after selecting those two and refreshing it manually. It is not included in the chart.
Screen-Shot-2015-04-17-at-8.30.05-AM.png
Screen-Shot-2015-04-17-at-8.30.05-AM.png
SOLUTION
membership
This solution is only available to members.
To access this solution, you must be a member of Experts Exchange.
ASKER CERTIFIED SOLUTION
membership
This solution is only available to members.
To access this solution, you must be a member of Experts Exchange.
You can replace all your charts with pivots charts which will essentially do what you are looking for..
Saurabh...
DSE-Carelog-Report.xlsm