How do i fix memory leaks with Windows WPF's dispatcher.BeginInvoke() call?
Hi:
I'm working a windows .Net C# WPF application.
The application displays video frames in addition to some additional analytic data in a canvas.
The app is processing a frame rate of about 15 frames per second.
Processing is completed on separate thread.
The processing thread sends callbacks when analysis is completed and the display is to be updated.
I've noticed some significant memory growth (leaks) as I run the application over a period of time.
After running for a couple of hours, the application's memory footprint grows to a size of over 200MB.
In order to try to track these leaks, I'm using red-gate's ANTs Memory Profiler.
Based on the results I've captured, it appears that my dispatcher.BeginInvoke() calls are
the source of at least some of the leaks. The dispatcher.BeginInvoke() is required as I am
updating the UI from a different thread (one other than the UI thread).
Here is a sample code block:
Thanks,
JohnB
I'm working a windows .Net C# WPF application.
The application displays video frames in addition to some additional analytic data in a canvas.
The app is processing a frame rate of about 15 frames per second.
Processing is completed on separate thread.
The processing thread sends callbacks when analysis is completed and the display is to be updated.
I've noticed some significant memory growth (leaks) as I run the application over a period of time.
After running for a couple of hours, the application's memory footprint grows to a size of over 200MB.
In order to try to track these leaks, I'm using red-gate's ANTs Memory Profiler.
Based on the results I've captured, it appears that my dispatcher.BeginInvoke() calls are
the source of at least some of the leaks. The dispatcher.BeginInvoke() is required as I am
updating the UI from a different thread (one other than the UI thread).
Here is a sample code block:
                    canvas.Dispatcher.BeginInvoke((Action)(() =>
                    {
                            // Clear the previous points
                            canvas.Children.Clear();
                            SolidColorBrush pointBrush = new SolidColorBrush(Colors.Cornsilk);
                            foreach (var point in points)
                            {
                                Ellipse ellipse = new Ellipse()
                                {
                                    Width = 4,
                                    Height = 4,
                                    Fill = pointBrush
                                };

                                canvas.Children.Add(ellipse);
                                Canvas.SetLeft(ellipse, point.x * XScaleFactor);
                                Canvas.SetTop(ellipse, point.y * YScaleFactor);
                            }

                            SolidColorBrush boundingBrush = new SolidColorBrush(Colors.Bisque);
                            Rectangle boundingBox = new Rectangle()
                            {
                                Width = width,
                                Height = height,
                                Stroke = boundingBrush,
                                StrokeThickness = 1,
                            };

                            canvas.Children.Add(boundingBox);
                            Canvas.SetLeft(boundingBox, xMin * mImageXScaleFactor);
                            Canvas.SetTop(boundingBox, yMin * mImageYScaleFactor);
                        }
}));Thanks,
JohnB
Just take a closer look at samples for drawing in MSDN.
As Sara wrote, you don't know when GC kicks in. Thus you need to help. This includes using using where possible. And calling Dispose where not.
Do this for all your objects used in the drawing method. E.g. your brushes and ellipses.
btw, using anonymous methods in this case is not a good idea. It makes testing harder.
ASKER
ste5an::
I'm not sure I follow you.
Ellipses, Rectangles and so on are do NOT implement IDisposable, therefore you cannot call Dispose() or use a "using statement".
Can you please be specific regarding your explanation of drawing shapes in WPF?
Thanks,
JB
I'm not sure I follow you.
Ellipses, Rectangles and so on are do NOT implement IDisposable, therefore you cannot call Dispose() or use a "using statement".
Can you please be specific regarding your explanation of drawing shapes in WPF?
Thanks,
JB
Do you really expect that I know the methods of every class?
I was talking about the conceptual problem.
You're creating a log of objects without disposing them. As you redraw those frames, you don't need the objects you draw in the frame before, but they still exist.
I was talking about the conceptual problem.
You're creating a log of objects without disposing them. As you redraw those frames, you don't need the objects you draw in the frame before, but they still exist.
ASKER
sarabande::> It looks like this might not be as obvious to figure it out. As I examine periodic snapshots from my session, I notice that I get an increased number of DispatcherOperation objects. It seems to be linear, in that the longer I run, the more I see. I assume that the DispatcherOperation object is associated with the control->BeginInvoke() call. Thoughts?
as far as i understand the issue, there are two choices where the increased memory growth may come from:
(1) there is a container or queue where managed objects were stored (added) but never removed. because of that, the gc can't release the storage for those managed objects.
(2) there is some unmanaged memory allocated - for example byte arrays needed for calls into winapi or c/c++ dlls - but never freed.
to check for (1) you may check the sizes of each dynamic container used by your threads.
to check for (2) you may analyze the arguments passed to calls into unmanaged dll's (for example winapi) and callback calls. if the worker thread sends data to the ui thread by callback, it is a good chance that new memory was need for this. try to find out whether the gc has a chance to release that memory, what should be the case if the receiver uses the same objects (classes) as the sender and if there was no transformation or cast operation between.
in order to find the pulprit you should comment some statements where new memory was allocated and pass/use static objects instead.
Sara
I assume that the DispatcherOperation object is associated with the control->BeginInvoke() call. Thoughts?sorry, from the information you posted, we don't know what the DispatcherObject is for, nor do we know what you intend to do with the BeginInvoke function. in the code snippet of your original post, there is nothing what could explain memory growth beside the points container would grow infinitely (the 'points' actually didn't seem to be cleared despite of a comment which is stating this).
Sara
ASKER
Sara::>
The basic architecture of the system is as follows:
1) The application has a callback handler that it receives callbacks from a CLI/C++ library
2) Based on parameters in the callback the application calls into the CLI/C++ library to retrieve
additional data
3) From that callback thread, the application updates the UI [we use BeginInvoke()] to update to manipulate
items on the UI thread from the callback's thread
I hope that gives you a little more context.
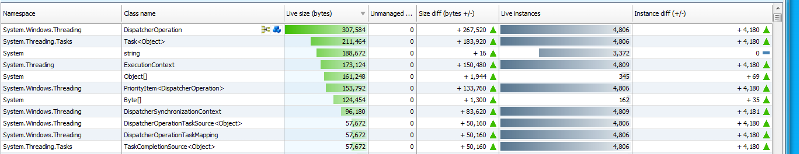
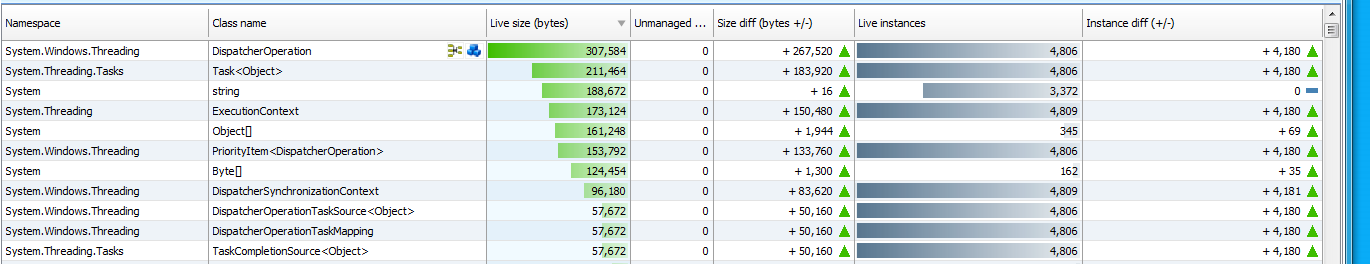
I've also attached a couple of screenshots from red-gate ant memory analyzer/profiler.

Thanks,
JB
The basic architecture of the system is as follows:
1) The application has a callback handler that it receives callbacks from a CLI/C++ library
2) Based on parameters in the callback the application calls into the CLI/C++ library to retrieve
additional data
3) From that callback thread, the application updates the UI [we use BeginInvoke()] to update to manipulate
items on the UI thread from the callback's thread
I hope that gives you a little more context.
I've also attached a couple of screenshots from red-gate ant memory analyzer/profiler.
Thanks,
JB
do you have the code of the cli/c++ library? if yes, please post the part where they pass objects or data via callback to your thread (point 1) and where they provide the additional data you requested from your callback thread (point 2).
for (3), can you identify the shared objects which were used from ui thread? how did you make them thread-safe?
Sara
for (3), can you identify the shared objects which were used from ui thread? how did you make them thread-safe?
Sara
ASKER
sarabande::> I will post code shortly.
Is there any way to upgrade to make this existing question private,
or do I have to close and start a new thread?
JB
Is there any way to upgrade to make this existing question private,
or do I have to close and start a new thread?
JB
i don't know how to make a question private, but there is no need to post full code or have the real names of variables or functions.
since my main expertise is c and unmanaged c++, it is much likely that other experts could add valuable postings with reference to the .net code.
beside of the code you may try to find out which of the points 1 to 3 of your previous comment adds most to memory growth. you should be able to see that if you comment parts of the functionality and see whether the memory consumptions keeps the same or not.
Sara
ASKER
sarabande::> I have been commenting pieces out to try to find the issue(s). It didn't really produce any obvious results. I will go back and redo that today. I will also post some code in a bit.
JB
JB
ASKER CERTIFIED SOLUTION
membership
This solution is only available to members.
To access this solution, you must be a member of Experts Exchange.
ASKER
sarabande::>
Here is the "cleansed" code fragment for one of the Callback implementations in our CLI/C++ Library:
I do have concerns that we have some leak going on here.
In terms of the DispatcherOperation issue I think that we are having, the solution and article you posted look promising. I am adding the code now and will test.
Thanks so much for the terrific help/attention/direction.
Thanks,
JohnB
Here is the "cleansed" code fragment for one of the Callback implementations in our CLI/C++ Library:
namespace Test
{
	private delegate void FirstEventHandler(Dictionary <int, Object1^>^ object1s, Object2^ object2);
	private delegate void SecondEventHandler(Object2^ object2);

	public interface class iClass
	{
	public:
		void OnResults1(Dictionary <int, Object1^>^ object1s, Object2^ object2);
		void OnResults2(Object2^ object2);
	};

	private ref class cClass
	{
		delegate void OnResults1(std::map<int, UnmanagedTest::Object1> object1s, UnmanagedTest::Object2 object2);
		delegate void OnResults2(UnmanagedTest::Object2 object2);

	public:
		event FirstEventHandler^ Result1s;
		event SecondEventHandler^ Result2s;

		cClass()
		{
			using System::IntPtr;
			using System::Runtime::InteropServices::Marshal;

			mOnResults1 = gcnew OnResults1(this, &cClass::OnResults1);
			IntPtr cbOnResults1 = Marshal::GetFunctionPointerForDelegate(mOnResults1);

			mOnResults2 = gcnew OnResults2(this, &cClass::OnResults2);
			IntPtr cbOnResults2 = Marshal::GetFunctionPointerForDelegate(mOnResults2);

			pImpl = new Impl(static_cast<Impl::OnResults1Callback>(cbOnResults1.ToPointer()),
				static_cast<Impl::OneResults2Callback>(cbOnResults2.ToPointer()));
		}

		!cClass()
		{
			delete pImpl;
			pImpl = nullptr;
		}
		~cClass()
		{
			this->!cClass();
		}

		Impl* GetImpl()
		{
			return pImpl;
		}

	private:
		void OnResults1(std::map<int, UnmanagedTest::Object1> object1s, UnmanagedTest::Object2 object2)
		{
			Dictionary <int, Object1^>^ manObject1s;
			Object2^ manObject2;

			manObject1s = gcnew Dictionary <int, Object1^>();
			manObject2 = Object2Helper::CreateObject2(object2);
			std::map<int, UnmanagedTest::Object1>::iterator itr = object1s.begin();
			for (; itr != object1s.end(); itr++)
			{
				manObject1s->Add(itr->first, Object1Helper::CreateAObject1(itr->second));
			}

			Results1(manObject1s, manObject2);
		}
		void OnResults2(UnmanagedTest::Object2 object2)
		{
			Object2^ manObject2;
			manObject2 = Object2Helper::CreateObject2(object2);
			Results2(manObject2);
		}
		Impl* pImpl;
		property OnResults1^ mOnResults1;
		property OnResults2^ mOnResults2;
	};
}I do have concerns that we have some leak going on here.
In terms of the DispatcherOperation issue I think that we are having, the solution and article you posted look promising. I am adding the code now and will test.
Thanks so much for the terrific help/attention/direction.
Thanks,
JohnB
ASKER
Sarabande::>
I added the DispatcherOperation cleanup code from the article.
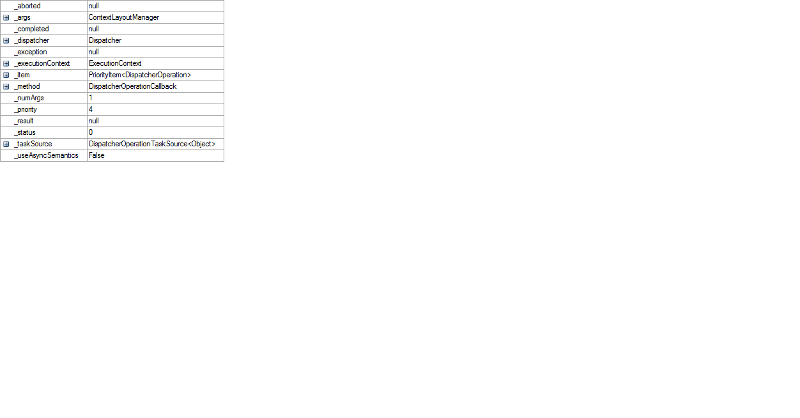
I think it's on the right track. Upon further examination, it appears to me that the DispatcherOperation objects which seem to be orphaned on the queue were not directly created by my BeginInvoke().
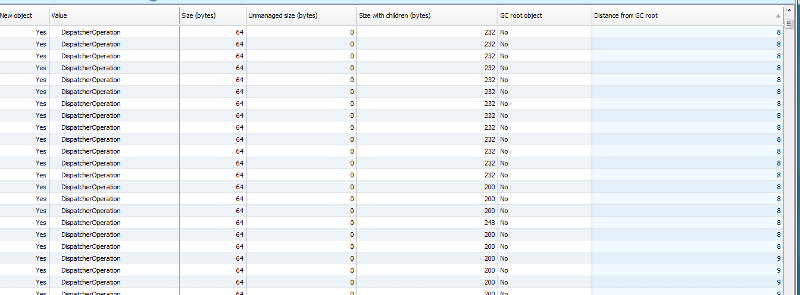
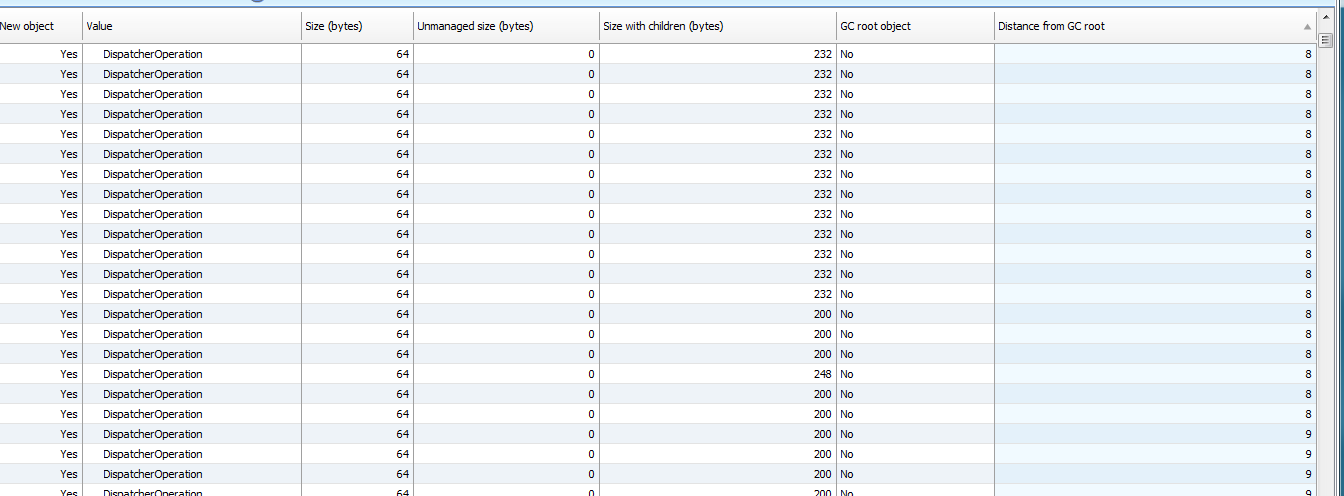
I've attached what the DispatcherOperation object data looks like:
I added the DispatcherOperation cleanup code from the article.
I think it's on the right track. Upon further examination, it appears to me that the DispatcherOperation objects which seem to be orphaned on the queue were not directly created by my BeginInvoke().
I've attached what the DispatcherOperation object data looks like:
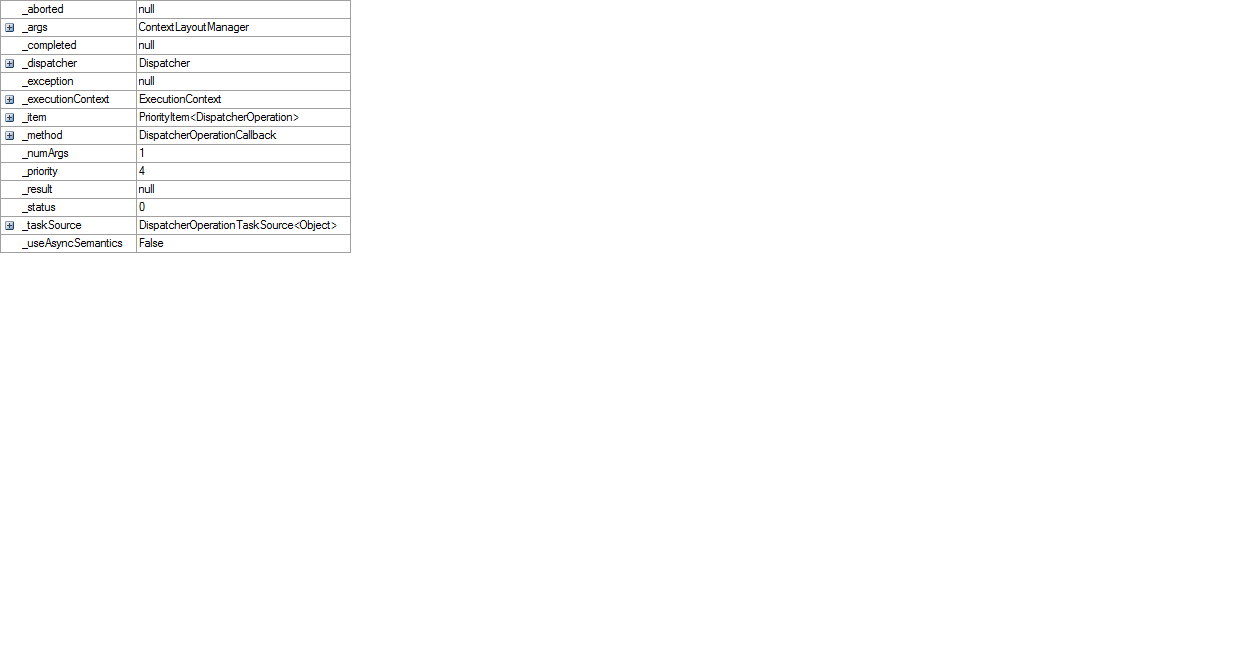
it appears to me that the DispatcherOperation objects which seem to be orphaned on the queue were not directly created by my BeginInvoke().hmm.
if you look into the sample code you see the statement:
LastOperations.Add(Dispatcher.BeginInvoke(
                        DispatcherPriority.Background,
                        new ParameterizedThreadStart(o => Items.Add(item))),
item))as told i am not so familiar with advanced c# syntax but from this statement it is rather obvious that each call of Dispatcher.BeginInvoke returns a reference to a new DispatcherOperation which needs to be 'aborted' when the operation was finished if you want to avoid that the object lives infinitely.
Sara
ASKER
Thanks for all the patience working on figuring this one out.
I finally figured out what the issue with the memory leak was. It comes down to (what I think) is a WPF bug.
Consider the following XAML mockup:
--------------------------
<StackPanel Name="stackPanelClassifier
Background="Transparent" Height="130" HorizontalAlignment="Stret
<Grid Name="gridClassifierDispla
Background="Transparent" Margin="0,5,0,0"
Width="{Binding ElementName=stackPanelClas
Height="{Binding ElementName=stackPanelClas
<Grid.ColumnDefinitions>
<ColumnDefinition Width="0.36*" />
<ColumnDefinition Width="0.28*" />
<ColumnDefinition Width="0.36*" />
</Grid.ColumnDefinitions>
<Grid.RowDefinitions>
<RowDefinition Height="40" />
<RowDefinition Height="40" />
<RowDefinition Height="40" />
</Grid.RowDefinitions>
<Grid>
</StackPanel>
With that layout definition, I was seeing a lot of <DispatchOperation> objects floating around in a pending state.(In addition to supporting objects). DispatchOperation objects are tied in with the UI display thread.
I was displaying frames @ 15/sec and they seemed to be increasing linearly at that rate.
I can recreate the issue without drawing anything at all in the grid (no controls, no nothing). Just having that kind of XAML definition causes the problem.
Then I changed the definition to:
--------------------------
<StackPanel Name="stackPanelClassifier
Background="Transparent" Height="130" HorizontalAlignment="Stret
<Grid Name="gridClassifierDispla
Background="Transparent" Margin="0,5,0,0"
Width="auto"
Height="130px" >
<Grid.ColumnDefinitions>
<ColumnDefinition Width="0.36*" />
<ColumnDefinition Width="0.28*" />
<ColumnDefinition Width="0.36*" />
</Grid.ColumnDefinitions>
<Grid.RowDefinitions>
<RowDefinition Height="40" />
<RowDefinition Height="40" />
<RowDefinition Height="40" />
</Grid.RowDefinitions>
</Grid>
</StackPanel>
Removing the dynamic binding of the grid's width/height to it's parent fixed the issue. The app now behaves in terms of memory usage.
Go figure.
Thanks!,
JB
great analysis.
the binding makes the gc unable to free the objects.
Sara
the binding makes the gc unable to free the objects.
Sara
for example, if you do a Clear on the canvas, the gc may or may not release the heap storage of the cleared objects,
because of that, i don't believe that the code snippet you posted really is responsible for leaks.
better candidates might be in the function where you send the results from one thread to the other, probably when you call the callback. here you may look whether you use heap memory that was allocated by the caller and must be freed by the callback function in the target thread. if both the caller and the callback were managed code (c#) you may try to avoid casts or allocating unmanaged memory, but use references to managed memory only. that would give the gc a chance to handle all the memory and avoid leaks.
Sara