Powerpoint charts created from Excel VBA won't refresh
Okay, so my code *works*... 99% of what I need it to do. The code below does pretty much everything I need. It opens powerpoint, creates slides based on a data table I've got in my excel spreadsheet, creates titles, sub-titles, charts, smoothed lines, ALMOST everything.
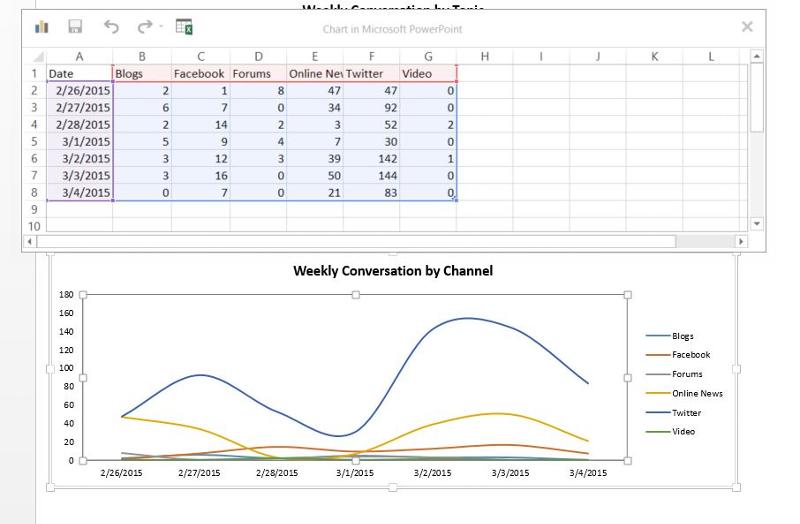
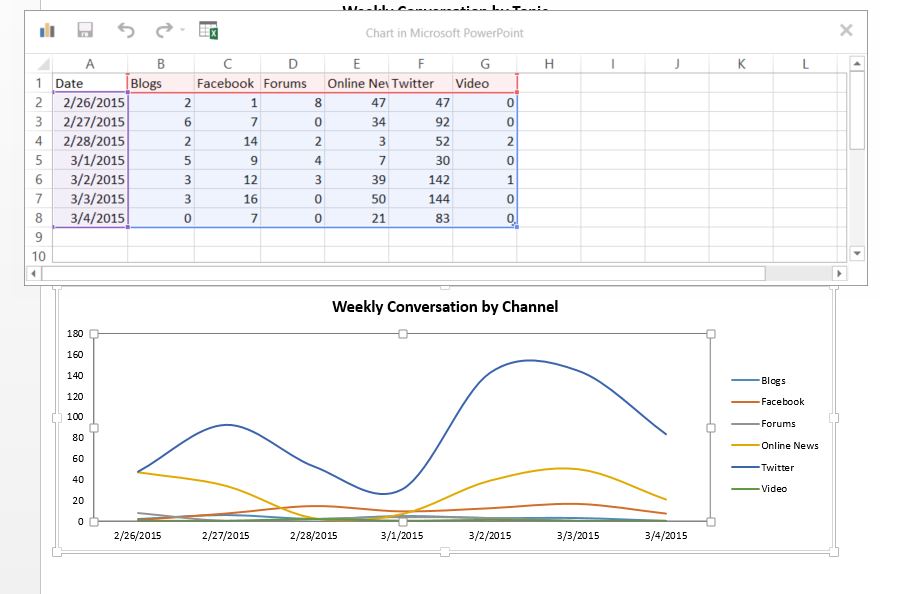
When I view my powerpoint, I see:
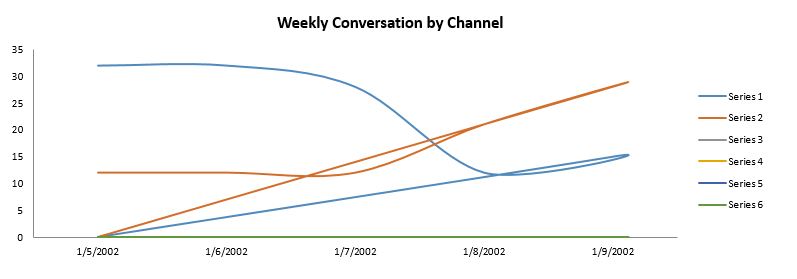
Which is not what the graph should look like...
When I click on EDIT DATA, the chart updates:
So, how do I get the chart to update without having to go slide by slide, chart by chart and EDIT DATA... Now, I know I could programmatically insert a module with code that someone could run after the ppt is created... but I want to put it all in a neat little bundle, so there's no need to do any other steps... because I should be able to do this with VBA...
it's killing me.
When I view my powerpoint, I see:
Which is not what the graph should look like...
When I click on EDIT DATA, the chart updates:
So, how do I get the chart to update without having to go slide by slide, chart by chart and EDIT DATA... Now, I know I could programmatically insert a module with code that someone could run after the ppt is created... but I want to put it all in a neat little bundle, so there's no need to do any other steps... because I should be able to do this with VBA...
it's killing me.
Sub create_ppt_file()

Dim subdir_name As String, range_name As String, sheet_name As String, chart_title_text As String, sub_title_text As String
Dim slide_title_text As String, reference_sheet As String, reference_range As String, font_name As String, object_title As String
Dim date_num As Date
Dim date_val As Long
Dim lheight As Double, lwidth As Double, lleft As Double, ltop As Double, iheight As Double, iwidth As Double
Dim x As Integer, field_counter As Integer, chart_variable As Integer, point_counter As Integer, q As Integer, i As Integer, slide_var As Integer
Dim f As Integer, row_nums As Integer, col_nums As Integer, array_rows As Integer, array_columns As Integer
Dim array_row_start As Integer, array_col_start As Integer, slide_num_hold As Integer, object_type As Integer
Dim colour_red As Integer, colour_green As Integer, colour_blue As Integer, font_size As Integer
Dim xlapp As Object, sheet As Object, mschart As Object, pptapp As Object, pptslide As Object, range_data As Object
Dim pptdata As Excel.Worksheet, shpgraph As Object, pptfile As Object, pptworkbook As Excel.Workbook
Dim range_value As Range
Dim data_array() As Variant

main:
sheet_name = "data for graphs"
reference_sheet = "data_tables"
reference_range = "slides_for_report"
range_name = "data_convo_by_topic"
Sheets(reference_sheet).Activate
Range(reference_range).Select
array_rows = Selection.Rows.Count - 1
array_columns = Selection.Columns.Count - 1
ReDim data_array(array_rows, array_columns) As Variant
array_row_start = ActiveCell.Row
array_col_start = ActiveCell.Column
For x = 0 To array_rows
  For y = 0 To array_columns
    data_array(x, y) = Cells(x + array_row_start, y + array_col_start).Value
  Next y
Next x
date_num = Range("end_date").Value
date_val = date_num
Set mschart = Nothing
Set pptworkbook = Nothing
Set pptdata = Nothing
Set pptslide = Nothing
Set pptapp = Nothing
Set xlapp = Nothing
Set pptapp = CreateObject("Powerpoint.Application")
Set pptfile = pptapp.Presentations.Add
slide_num_hold = 1
Set pptslide = pptfile.Slides.Add(slide_num_hold, 12)
lheight = 562
lwidth = 999
pptfile.PageSetup.SlideHeight = lheight
pptfile.PageSetup.SlideWidth = lwidth

For x = 0 To array_rows
  slide_var = data_array(x, 1)
  object_type = data_array(x, 2)
  Select Case object_type
    Case Is = 3
      range_name = data_array(x, 3)
      chart_variable = data_array(x, 5)
    Case Else
      range_name = ""
      chart_variable = 0
  End Select
  object_title = data_array(x, 4)
  Select Case slide_var
    Case Is > slide_num_hold
      Set pptslide = pptfile.Slides.Add(slide_var, 12)
      lheight = 562
      lwidth = 999
      pptfile.PageSetup.SlideHeight = lheight
      pptfile.PageSetup.SlideWidth = lwidth
      slide_num_hold = slide_var
  End Select
  lheight = data_array(x, 6)
  lwidth = data_array(x, 7)
  lleft = data_array(x, 8)
  ltop = data_array(x, 9)
  font_name = data_array(x, 10)
  font_size = data_array(x, 11)
  slide_title_text = data_array(x, 12)
  field_counter = 0
  Application.ScreenUpdating = False
  Select Case object_type
    Case 1, 2
      pptslide.Shapes.AddTextbox(1, lleft, ltop, lwidth, lheight).Name = object_title
      pptslide.Shapes(object_title).TextFrame.TextRange.Text = slide_title_text
      pptslide.Shapes(object_title).TextFrame.WordWrap = 1
      pptslide.Shapes(object_title).TextFrame.TextRange.Font.Name = font_name
      pptslide.Shapes(object_title).TextFrame.TextRange.Font.Size = font_size
      pptslide.Shapes("title_box").TextFrame.TextRange.Font.Bold = True
    Case 3
      Set xlapp = ActiveWorkbook
      xlapp.Sheets(sheet_name).Activate
      xlapp.Sheets(sheet_name).Range(range_name).Select
      With Selection
          col_nums = Range(range_name).Columns.Count
          row_nums = Range(range_name).Rows.Count
      End With
      Set mschart = pptslide.Shapes.AddChart(1, lleft, ltop, lwidth, lheight).Chart
      Set pptworkbook = mschart.ChartData.Workbook
      Set pptdata = pptworkbook.Worksheets(1)
      pptdata.ListObjects("Table1").Resize pptdata.Range("A1:g8")
      mschart.SetSourceData Source:="='sheet1'!a1:g8", PlotBy:=xlColumns
      mschart.Refresh
      xlapp.Sheets(sheet_name).Activate
      xlapp.Sheets(sheet_name).Range(range_name).Select
      With Selection
        .Copy
      End With
      pptdata.Activate
      pptdata.Range("a1:g8").Select
      Selection.PasteSpecial Paste:=12
      pptworkbook.Close True
      Set pptworkbook = Nothing
      Set pptdata = Nothing
      mschart.Name = "topic_chart"
      mschart.ChartType = chart_variable
      mschart.ChartArea.Font.Name = "Calibri"
      mschart.ChartArea.Font.Size = 8
      point_counter = 0
      With mschart
        .HasTitle = True
        .ChartTitle.Text = slide_title_text
        .ChartTitle.Font.Size = 12
        .ChartTitle.Font.Bold = True
        .Axes(1).HasTitle = False
      End With
      Rem 1 is y
      Rem 2 is x
      mschart.Axes(1).TickLabelPosition = -4134
      mschart.Axes(1).MajorTickMark = -4142
      mschart.Axes(1).MinorTickMark = -4142
      mschart.Axes(1).HasMajorGridlines = 0
      mschart.Axes(1).HasMinorGridlines = 0
      mschart.Axes(2).MinimumScale = 0
      mschart.Axes(2).TickLabelPosition = -4134
      mschart.Axes(2).MajorTickMark = -4142
      mschart.Axes(2).MinorTickMark = -4142
      mschart.Axes(2).HasMajorGridlines = 0
      mschart.Axes(2).HasMinorGridlines = 0
      mschart.HasLegend = True
      mschart.Legend.Position = -4152
      mschart.Legend.Border.LineStyle = -4142
      i = 1
      For Each Series In mschart.SeriesCollection
        mschart.SeriesCollection(i).MarkerStyle = -4142
        mschart.SeriesCollection(i).Smooth = 1
        i = i + 1
      Next Series
      Rem mschart.Application.Update doesn't work... *headdesk*
    Case 4
  End Select

Next x
GoTo exit_sub

err_report:
  Select Case Err.Number
    Case 1004, -2147417851
      MsgBox "Want to resume?", vbOKOnly
      Resume
    Case Else
      MsgBox "Error Number: " & Err.Number & vbCrLf & vbCrLf & "Error Description: " & Err.Description
  End Select

exit_sub:
  Application.ScreenUpdating = True
  Set mschart = Nothing
  Set pptslide = Nothing
  pptapp.Visible = True
  Set pptapp = Nothing
  Set xlapp = Nothing

End SubASKER
@rgonzo1971 Thanks for the idea... still not updating the view by VBA.
Is there something specific that the "Edit Data" function does?
Is there something specific that the "Edit Data" function does?
ASKER CERTIFIED SOLUTION
membership
This solution is only available to members.
To access this solution, you must be a member of Experts Exchange.
ASKER
I had previously used the .Activate in another area. Tried your recommendation... still nothing. Next step will be to load the Excel data into an array and place it cell by cell rather than do a copy/paste... see if the system deals with that differently.
Nuclear option is to write a macro in PPT that opens the edit data section... so I'd add the module using Excel VBA, and then have the macro available after everything is all done.
Nuclear option is to write a macro in PPT that opens the edit data section... so I'd add the module using Excel VBA, and then have the macro available after everything is all done.
      source_text = "=sheet1!b2:" & Chr(64 + col_nums) & row_nums + 1
      mschart.SetSourceData Source:=source_text, PlotBy:=xlColumns
      pptdata.Range("a1:" & Chr(64 + col_nums) & row_nums + 1).Delete
      pptworkbook.RefreshAll
      xlapp.Sheets(sheet_name).Activate
      xlapp.Sheets(sheet_name).Range(range_name).Select
      With Selection
        .Copy
      End With
      pptdata.Activate
      pptdata.Range("a1:" & Chr(64 + col_nums) & row_nums + 1).Select
      Selection.PasteSpecial Paste:=12
      pptworkbook.Close True
      Set pptworkbook = Nothing
      Set pptdata = Nothing
mschart.Name = range_nameASKER
So, RGONZO1971... I made a slight tweak to your recommendation, and it works fine. I have the system loop through all the charts after all the updates have been done, and now I end up with updated charts looking like updated charts... Thank you for your help with this one.
  For x = 0 To array_rows
    slide_var = data_array(x, 1)
    object_type = data_array(x, 2)
    object_title = data_array(x, 4)
    Select Case object_type
      Case Is <> 3
      Case 3
        pptfile.Slides(slide_var).Shapes(object_title).Chart.ChartData.Activate
        pptfile.Slides(slide_var).Shapes(object_title).Chart.ChartData.Workbook.Close
    End Select
Next xASKER
RGONZO1971 responded quickly, and didn't give up on me. Thanks for the help.
pls try
mschart.Refresh
instead of update
Regards