Recommended SQL profile for MySQL
We are searching for an SQL profiler for MySQL equivalent to Microsoft SQL Profiler.
So far our search came up withe the following:
- Neor Profiler SQL
- MyTop
- MySQL's new profiler that is in version 5.0.37 of the community server
- LogMonitor
- Show Profiles Syntax
- JET profiler
- Query-Digest-UI
- Configure MySQL to log all queries it's given
- Maatkit. mk-query-profiler
- and found info on doing it straight in the MySQL engine using the configuration file (something called “Logging and Replication”).
As you can see the data it's overwhelming, especially for us which are new to MySQL. So this is where EE comes in. We would like EE opinion for a tool that works like a MS SQL Profiler but for MySQL, that would be understandable and maybe not too complicated and hopefully free.
SOLUTION
membership
This solution is only available to members.
To access this solution, you must be a member of Experts Exchange.
Lets clear up something: Almost nobody here is employee of experts exchange.
I like mysql studio...
I like mysql studio...
ASKER
What does that mean???
That I never heard of 1/2 of your products, but you leave out some very common ones.
ASKER
As you said before "Almost nobody here is employee of experts exchange". That being said, before we place a question, we do our work and try find the answer to whatever problem we are facing. When we can't, that's when place a question on EE for assistance.
The "products" you refer to is a list of apps that we found. We are not familiar with those "products" but for what we have read it seems that it may be used in some way as a Profiler for MySQL (we use the name "Profiler" because we are familiar with MS SQL and this product has an application called Profiler). We place the list just for reference incase an EE has any knowledge of them and maybe facilitate assisting us.
We are not expert in MySQL and started working on this engine.
We would appreciate EE on assisting us in finding a solution for some sort of Profiler for MySQL, similar as the Profiler in Microsoft.
You understand this is open forum, not something that Experts Exchange finds answers for you.
"SQL Server Profiler" workalike is called "Slow query log" since MySQL v4.0
Percona Toolkit and MySQL Studio both can visualize it.
"SQL Server Profiler" workalike is called "Slow query log" since MySQL v4.0
Percona Toolkit and MySQL Studio both can visualize it.
ASKER
Which one is best for you?
Usually top query makes 90% of log, so I use good old grep.
Both GUIs are free, so I see no reason you dont try them out...
Both GUIs are free, so I see no reason you dont try them out...
ASKER
Please provide the links of both you use so we can work them.
Thanx
Thanx
ASKER
(can't seem to find them)
ASKER
Oh ok, you talking about "Percona Toolkit". That's one of the apps we research (it's on our list "Maatkit. mk-query-profiler" which is now "Percona Toolkit for MySql"). Your link didn't work but we found it at https://www.percona.com/software/percona-toolkit.
Ok, will proceed to download and work with it.
Ok, will proceed to download and work with it.
ASKER
We download it but there is no EXE application on the compress file also there is no installation guide. Anyways, we extracted, copied it to Program Files but found no applications, just no-extensions files (see pic).
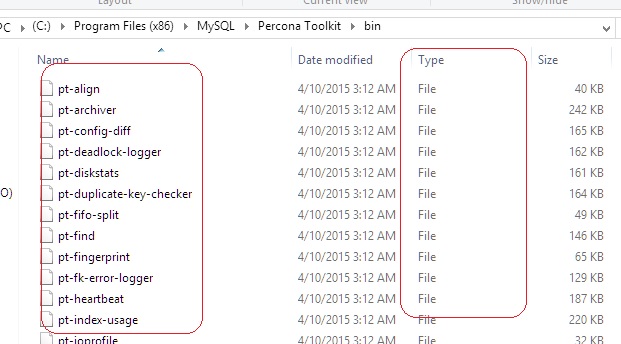
Are we missing something or is "Percona Toolkit" compatible with Windows? (we are using MySQL version 5.0.91 in Windows 8)
Are we missing something or is "Percona Toolkit" compatible with Windows? (we are using MySQL version 5.0.91 in Windows 8)
MySQL 5.0 is EOL EOL EOL EOL
If you are not able to install some tool - choose next. If you cannot find it on your desktop ask google.
If you are not able to install some tool - choose next. If you cannot find it on your desktop ask google.
ASKER
There is no next. Like said previously, there is no EXE application in the download; and we doenload from actual percona website https://www.percona.com/downloads/percona-toolkit/ (see pic below).

Downloaded the first ("percona-toolkit-2.2.14-1
If Percona Toolkit is not for Windows, what is the other tool you use as stated in ID: 40779870?
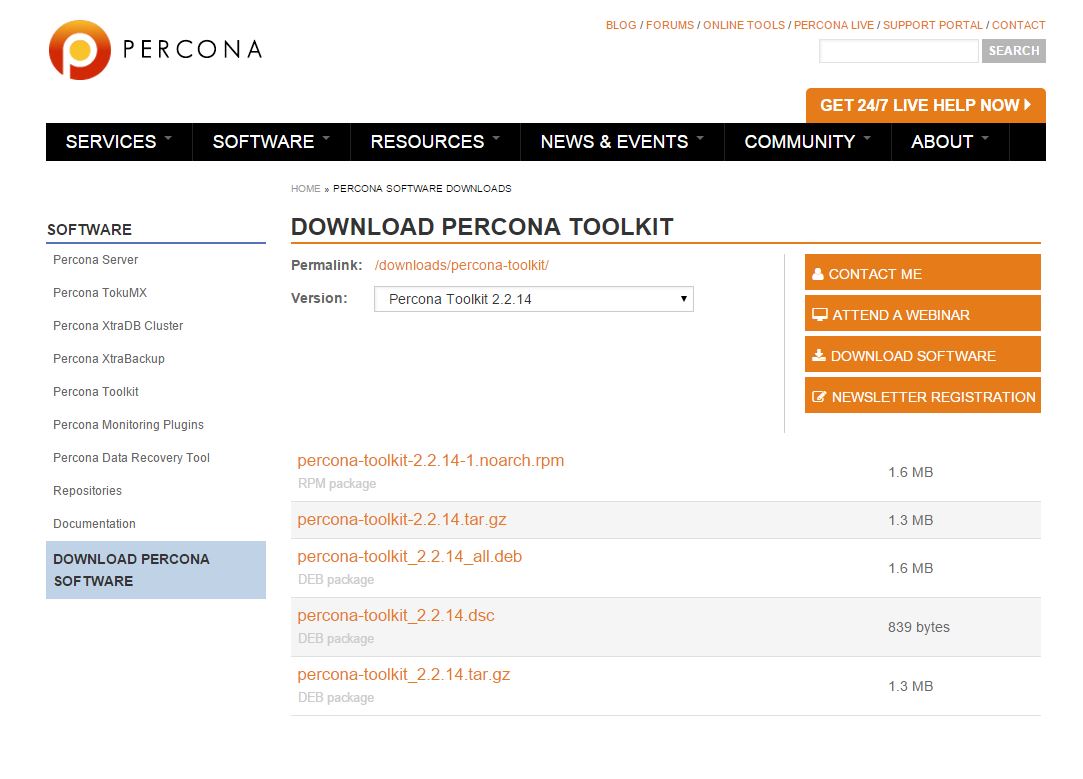
Downloaded the first ("percona-toolkit-2.2.14-1
If Percona Toolkit is not for Windows, what is the other tool you use as stated in ID: 40779870?
ASKER
We downloaded percona as en EE recommended (https://www.percona.com/downloads/percona-toolkit/ ) but the package doesn't have an executable applkication. Downloaded the first package of "percona-toolkit-2.2.14-1.
Is there an actual install of this application or what software we can use to work like a profiler that would monitor any apps that be working with MySQL database engines.
Is there an actual install of this application or what software we can use to work like a profiler that would monitor any apps that be working with MySQL database engines.
I think the Percona tools are only available for Linux systems, not Windows:
https://www.percona.com/services/mysql-support/percona-toolkit-supported-platforms-and-versions
Since it's quite unusual to run MySQL on Windows you're going to run into that issue quite a bit when looking for tools.
We profile MySQL in two ways - parsing the slow query log (and adjusting the threshold there to show more than the default queries) and collecting stats from the clients on their response times per query - but we do that in code in Java, rather than using a profiler. Not a great answer for your question I'm afraid.
Doug
ASKER
Thank you very much for your input.
At this point and for testing this need, we have MySQL installed in a Windows PC. We use Workbench for managing the database. The application that we want to monitor table-access is a web app. In essence what we are trying to do is trying to actually monitor what tables are being access by this web app (which has become tedious and troublesome; thus the reason we placed the question).
That being said, can you shed some light on your comment on how you guys has gone about it? In your entry you said "parsing the slow query log (and adjusting the threshold there to show more than the default queries) and collecting stats from the clients on their response times per query". If it's not too complicated, can you provide some example or guidance on the How-to?
It is as easy as installing linux in vmware player.... It can even connect windows MySQL (though you have to reconsider upgrade as your version is EOL, has fundamental security flaws that cannot be fixed, and probably already loses data under the hood)
ASKER
Don't understand. We just want to monitor the tables being access by an web apps. MySQL being installed and used more that Microsoft SQL, we thought this was a question with quick answer. Sorry we don't understand exactly what to do. Is there a simpler way?
If it's not too complicated, can you provide some example or guidance on the How-to?In our case, we just record each time a call is made to the database - what the query was an how long it took, in code.
But it sounds like you are looking for a tool that you can just plug in and use to examine the behavior of an existing app, without modifying it.
You might be better off looking at a tool like DynaTrace (http://www.dynatrace.com/en/index.html).
They specifically try to provide performance data on web apps with a focus on where they are spending time making database queries etc. They're a commercial product, but I see they offer a free tier. I've not personally used them but I hear good things about their product.
If you decide you want to explore it, there's slides explaining the high level goals of the tool here:
http://de.slideshare.net/grabnerandi/java-performance-mistakes
together with contact info for one of their engineers - who I'm sure would be only too happy to help answer your questions.
Doug
Percona was not the only tool mentioned. Here another https://dev.mysql.com/downloads/workbench/ with full windows support
ASKER
We have Workbench but haven't been the option to trace MySQL queries.
Can you tell us where in workbench is it?
Can you tell us where in workbench is it?
you can explain queries, it is SQL feature.
ASKER
Please provide an example (we are not full MySql knowledgeable yet)
Knowlege comes from reading books for last few thousands of years....
https://dev.mysql.com/doc/refman/5.7/en/using-explain.html
https://dev.mysql.com/doc/refman/5.7/en/using-explain.html
ASKER
We went to that site prior our entry (and other site) and we got these examples, to name a few:
and
We have ran it with the EXPLAIN format but for some reason it doesn't display any trace.
Ok, we have the table CUSTOMER and set the following script:
No tracing display.
Are we doing it right? What are we missing?
EXPLAIN SELECT * FROM categoriesGand
EXPLAIN EXTENDED SELECT City.Name FROM City
JOIN Country ON (City.CountryCode = Country.Code)
WHERE City.CountryCode = 'IND' AND Country.Continent = 'Asia'GWe have ran it with the EXPLAIN format but for some reason it doesn't display any trace.
Ok, we have the table CUSTOMER and set the following script:
EXPLAIN SELECT * FROM CUSTOMERNo tracing display.
Are we doing it right? What are we missing?
Next SQL server version will mandate ANSI SQL 86 feature - semicolons at the end of SQL statement.
Explain is good if you have a query that is slow and you want to figure out why.
But if you're searching for a profiler I suspect you don't know yet which of your queries are problems.
In that case the simplest option is just to look at the slow query log - since that requires no additional tools and is designed to tell you where things are sluggish.
You can read about how to enable and configure that here:
https://dev.mysql.com/doc/refman/5.5/en/slow-query-log.html
There's also an explanation from the Percona people (who wrote some of those other tools you looked at) about what to look for and how to use this log to improve db performance:
https://www.percona.com/blog/2014/03/14/tools-and-tips-for-analysis-of-mysqls-slow-query-log/
Hope that helps,
Doug
ASKER
We don't have queries with problem or being slow. What we want is to find a tool, if there exist for MySQL, that would monitor tables being access in MySQL engine. As for Percona, it is not for Windows environment.
Trying to provide a more clear of what we are trying to accomplish, In Microsoft SQL profiler, you just start a trace and the profiler would display every query that an application is accessing (updating, inserting, deleting rows).
This is what are trying to find. Can this be done in MySQL?
Trying to provide a more clear of what we are trying to accomplish, In Microsoft SQL profiler, you just start a trace and the profiler would display every query that an application is accessing (updating, inserting, deleting rows).
This is what are trying to find. Can this be done in MySQL?
Normal way of monitoring MySQL is examining slow query log and explaining found queries.
Percona is only tool that links both pieces together
https://www.percona.com/doc/percona-toolkit/2.2/system_requirements.html
As you see it requires PERL (which is nicely available on Windows from ActiveState) and bash (From Microsoft SFU, MinGW, Cygwin or OBS)
Percona is only tool that links both pieces together
https://www.percona.com/doc/percona-toolkit/2.2/system_requirements.html
As you see it requires PERL (which is nicely available on Windows from ActiveState) and bash (From Microsoft SFU, MinGW, Cygwin or OBS)
ASKER
We have gone thru the link and haven't been succesfull in accomplishing it. Greatly appreciate some guidance.
Ok, we have MySQL version 5.0.91 installed in Windows 8. We have a custom made web apps that uses the databases of MySQL within the same PC.
That being said, what exactly do we need to do in order to accomplish this on our Windows 8 PC?
Ok, we have MySQL version 5.0.91 installed in Windows 8. We have a custom made web apps that uses the databases of MySQL within the same PC.
That being said, what exactly do we need to do in order to accomplish this on our Windows 8 PC?
Install software requirements and run scripts supplied?
You can install .net and powdershell? Should not be any different.
You can install .net and powdershell? Should not be any different.
ASKER
We have gone thru the link unfortunately with no successful. To give you more detail:
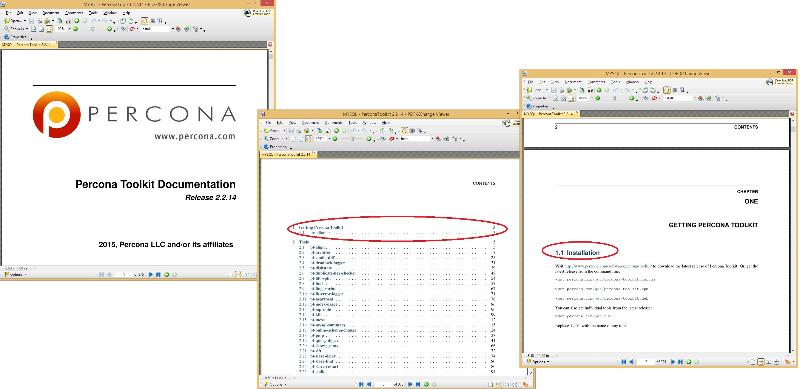
- In your link we click the latest version 2.2 (assumed this is the one you recommend)
- Then we are sent PERCONA TOOLKIT DOCUMENTATION
- We then click Installation link and is sent to INSTALLATION screen
There we get these page:

Since we don't understand what is "wget" and based on expert dpearson in entry ID: 40817121, "Percona tools are only available for Linux systems, not Windows", it seems that the link provided is for Linux not Windows
We are not expert in MySQL. If your recommendation is based for a Windows environment, please provide direct links to download your recommendations or perl and precona for windows.
Please excuse our non-expertise on the MySql and greatly appreciate you time and patient.
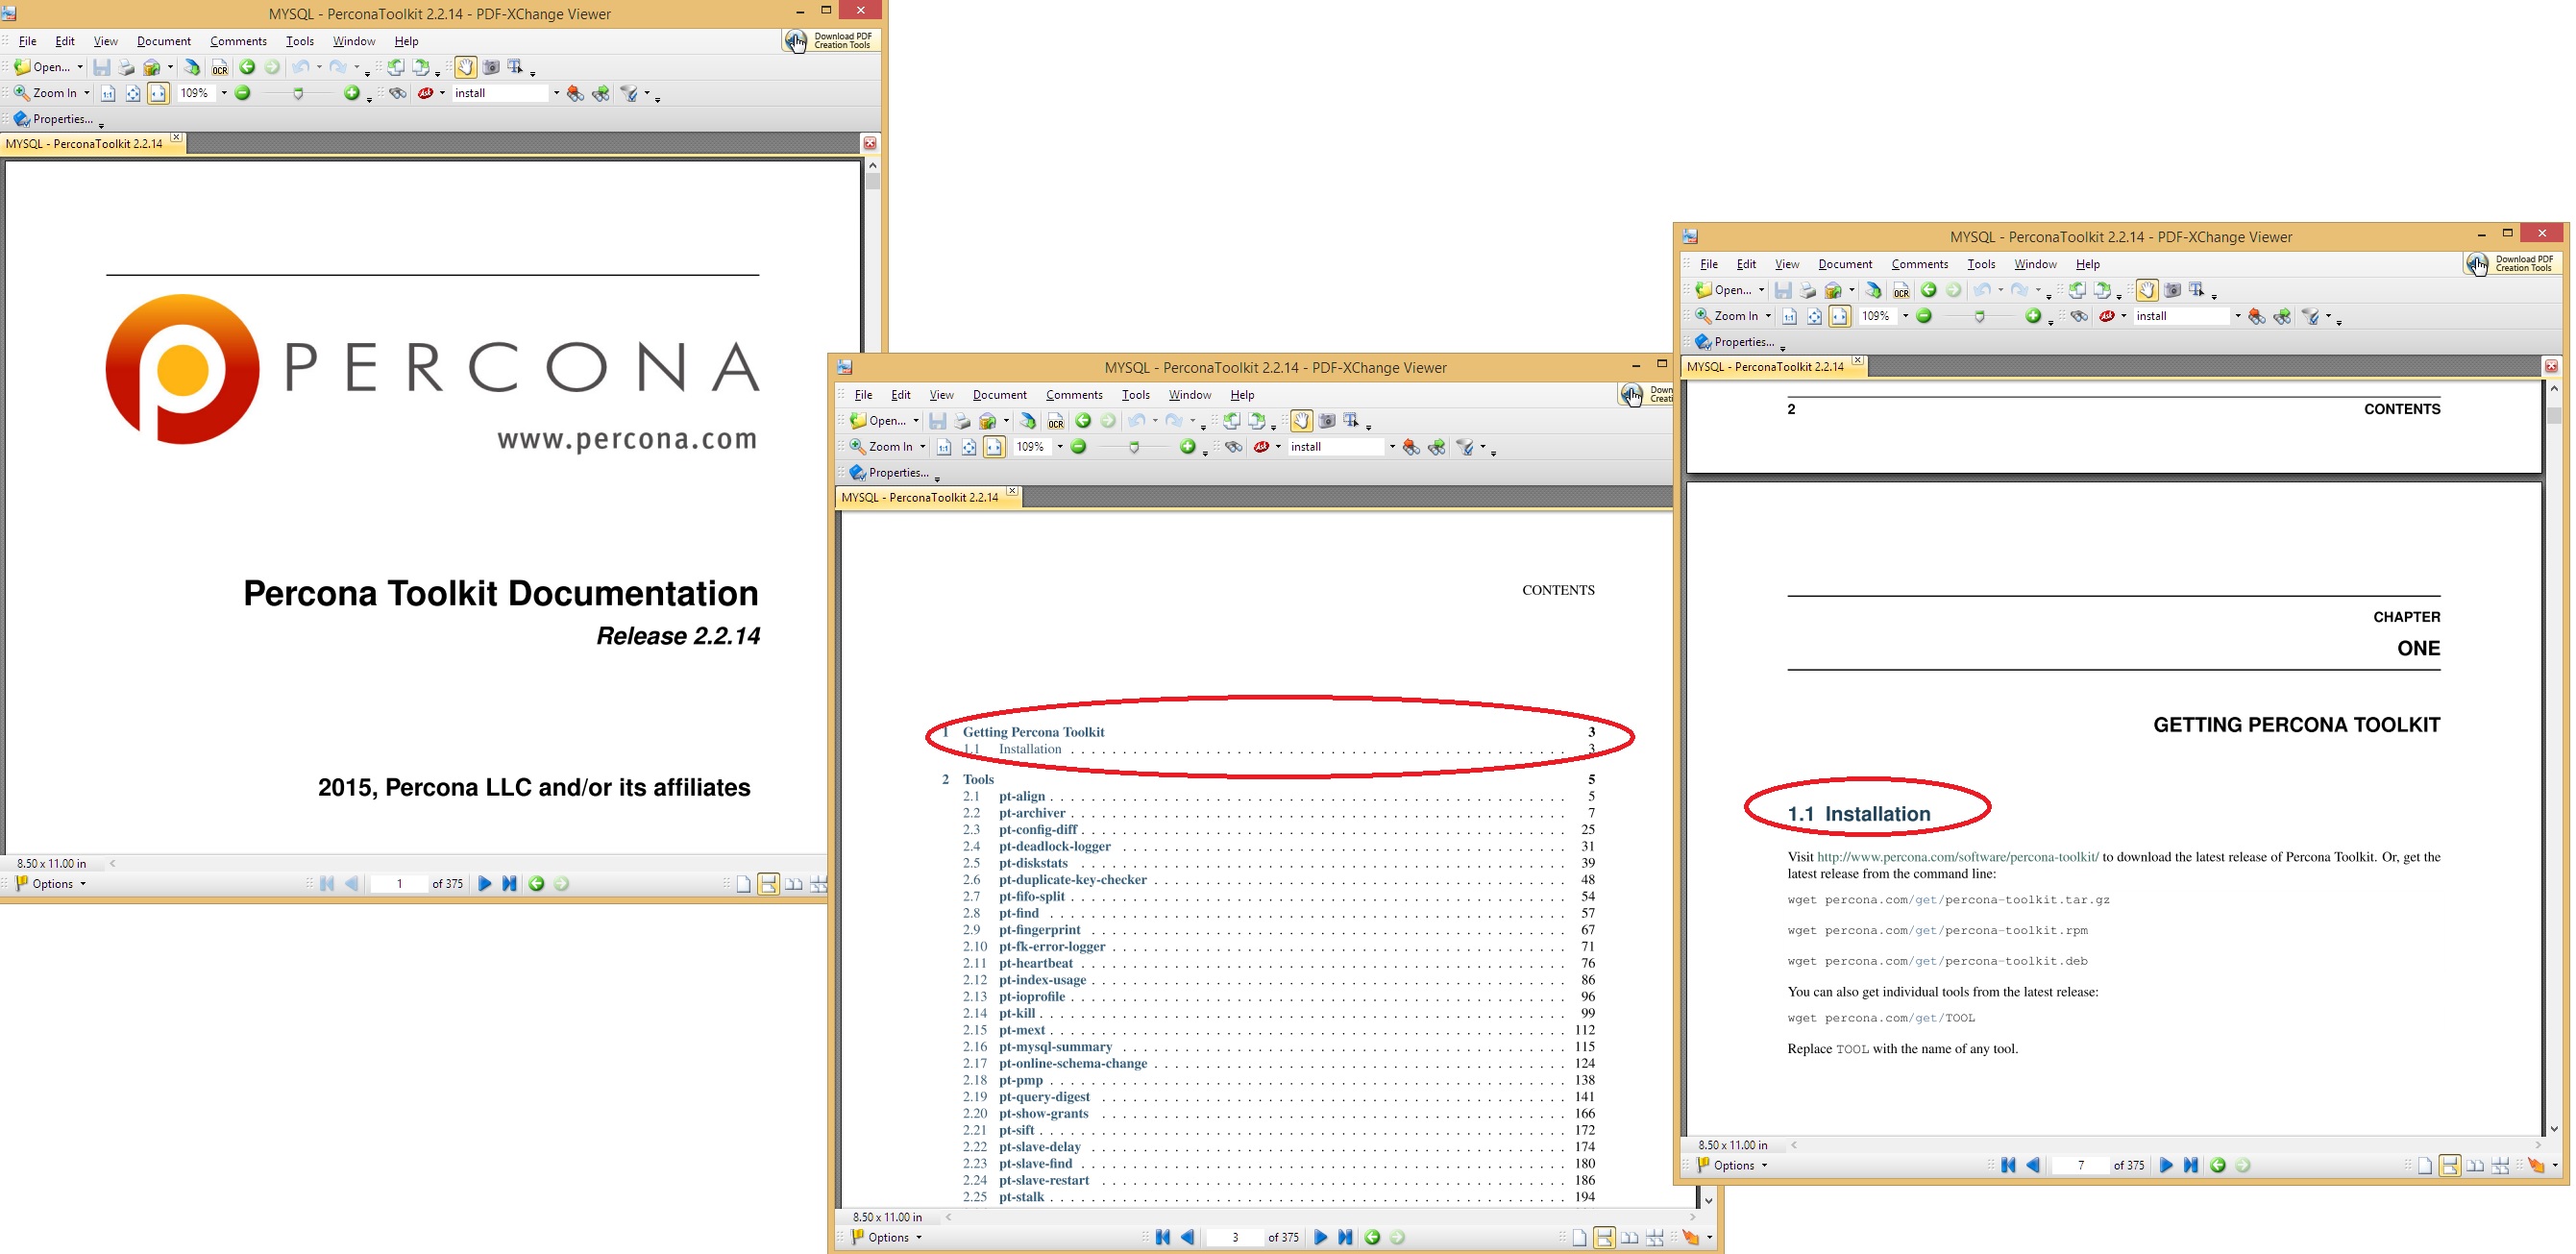
- In your link we click the latest version 2.2 (assumed this is the one you recommend)
- Then we are sent PERCONA TOOLKIT DOCUMENTATION
- We then click Installation link and is sent to INSTALLATION screen
There we get these page:
Since we don't understand what is "wget" and based on expert dpearson in entry ID: 40817121, "Percona tools are only available for Linux systems, not Windows", it seems that the link provided is for Linux not Windows
We are not expert in MySQL. If your recommendation is based for a Windows environment, please provide direct links to download your recommendations or perl and precona for windows.
Please excuse our non-expertise on the MySql and greatly appreciate you time and patient.
Trying to provide a more clear of what we are trying to accomplish, In Microsoft SQL profiler, you just start a trace and the profiler would display every query that an application is accessing (updating, inserting, deleting rows).
The MySQL slow query log can do this for you. You just set the threshold for "slow" to be 0ms and it will log every query. It's all explained in the Percona blog post.
Again, no special tools required, it's all built in.
Doug
I did not read any Linux in system requirements. It is some godzilla you imagined. Please install required software libraries and run percona scripts. SFU or Cygwin install them right away, though starting with activestate and rounding up with OBS feels to me more windows-like approach.
ASKER
dpearson, we read the blog. As to what we understand, we have to:
1. Run the the following script in our MySQL version 5.0.91 server BEFORE having any apps accessing the tables:
2. We have to keep line above as is: SET GLOBAL long_query_time=0; (as the blog says "It is recommended to set long_query_time=0"
3. Then run the apps and have it access the MySQL database tables.
4. Finally. in order to view the traced queries, we have to use "explain output" by using Percona tools, "pt-query-digest"
Is this correct assumption of what is indicated in the blog?
1. Run the the following script in our MySQL version 5.0.91 server BEFORE having any apps accessing the tables:
-- Save previous settings
mysql> SELECT @@global.log_slow_verbosity INTO @__log_slow_verbosity;
mysql> SELECT @@global.long_query_time INTO @__long_query_time;
mysql> SELECT @@global.slow_query_log INTO @__slow_query_log;
mysql> SELECT @@global.log_slow_slave_statements INTO @__log_slow_slave_statements;
-- Keep this in safe place, we'll need to run pt-query-digest
mysql> SELECT NOW() AS "Time Since";
-- Set values to enable query collection
mysql> SET GLOBAL slow_query_log_use_global_control='log_slow_verbosity,long_query_time';
mysql> SET GLOBAL log_slow_verbosity='full';
mysql> SET GLOBAL slow_query_log=1;
mysql> SET GLOBAL long_query_time=0;
mysql> SET GLOBAL log_slow_slave_statements=1;
-- Verify settings are OK
mysql> SELECT @@global.long_query_time, @@global.slow_query_log, @@global.log_slow_verbosity;
-- wait for 30 - 60 minutes
-- Keep this one too, also for pt-query-digest
mysql> SELECT NOW() AS "Time Until";
-- Revert to previous values
mysql> SET GLOBAL slow_query_log=@__slow_query_log;
mysql> SET GLOBAL long_query_time=@__long_query_time;
mysql> SET GLOBAL log_slow_verbosity=@__log_slow_verbosity; -- if percona server
mysql> SET GLOBAL log_slow_slave_statements=@__log_slow_slave_statements;
-- Verify settings are back to previous values
mysql> SELECT @@global.long_query_time, @@global.slow_query_log, @@global.log_slow_verbosity, @@global.slow_query_log_file;
-- Then with pt-query-digest run like (replace values for time-since, time-until and log name)
$ pt-query-digest --since='<time-since>' --until='<time-until>' --limit=100% /path/to/slow_query_log_file.log > /path/to/report.out
-- If you're not using Percona Server then you need to remove all references to log_slow_verbosit2. We have to keep line above as is: SET GLOBAL long_query_time=0; (as the blog says "It is recommended to set long_query_time=0"
3. Then run the apps and have it access the MySQL database tables.
4. Finally. in order to view the traced queries, we have to use "explain output" by using Percona tools, "pt-query-digest"
Is this correct assumption of what is indicated in the blog?
ASKER
gheist, please provide the link to download and installed your recommended tools (we couldn't find them in the page given)
I leave that to your exercise. I am a unix admin and really dont know much what you windows admins do. Your initial question did not mentioned you like to carry burden of Windows, so Linux was assumed and nearly perfect percona toolkit suggested.
You can install any of toolsets I mentioned, making sure you install bash and perl, rest of perl modules are installed after via PPM - perl package manager.
You can install any of toolsets I mentioned, making sure you install bash and perl, rest of perl modules are installed after via PPM - perl package manager.
ASKER
You are correct. Just reread the initial question and there is no mention that we are in Windows. Please excuse us, we thought we included. Yet, the next day, ID: 40780024, we did say we we are using MySQL version 5.0.91 in Windows 8.
That being said, what should we do? Delete the question and start a new one?
That being said, what should we do? Delete the question and start a new one?
Take my advice and install activestate perl and bash ?
ASKER
We understand Activestate Perl is to have Perl under Windows hood, but what is bash for?
It is a shell program like ps1.exe or cmd.exe
ASKER
Thanx understood.
After downloading and installing them, what next?
After downloading and installing them, what next?
find perl package manager and install perl modues, then unzip tar.gz file to wherever and follow the guide to get started.
ASKER
Activestate Perl has been installed and Win-Bash extracted and placed "Program Files".
What guide are you referring to?
What guide are you referring to?
As to what we understand, we have to:
That approach should work - but you can also do the same things by setting the configuration in the mysql config files:
https://dev.mysql.com/doc/refman/5.1/en/option-files.html
and then restarting the server itself. That way you don't need to run commands prior to the queries executing, since it's all setup as soon as the server starts.
What they are describing is how you can turn on the logging for an existing running server without restarting it. Which also works, but I don't think you're concerned with having to restart it.
Also the final step:
4. Finally. in order to view the traced queries, we have to use "explain output" by using Percona tools, "pt-query-digest"Is optional. That's a tool that you can use to review the output - but if you can't run the Percona tools you can also inspect the logs yourself. They are just text files with a few lines of output for each query. You can parse them yourselves to get the list of all tables accessed, average query times etc.
Doug
The programs must be in PATH
Now find ppm and install needed perl libraries
And run scripts included in percona tar.gz
Now find ppm and install needed perl libraries
And run scripts included in percona tar.gz
ASKER
dpearson:
Thank you very much! With what you said, we think we have a better understanding of this. That means in order to have a type of tracing or monitoring of what tables and scripts are being executed by any apps, we first have to configure the MySQL server by modifying a configuration file the Server reads prior starting. Then when any applications or web application is accessing the MySQL tables, it creates a log where we can look a directly and it contains the scripts that these application executed.
If what we understand is correct, can you supply a configuration file since you have pro experience on MySQL and also tell us where the log file is located at so we can start working with it? (we have been reviewing the link trying to understand and come up with the configuration file but since you are experience in MySQL it would greatly help us with our task since its been almost a month trying to figure this out... if you can't we would understand and continue... Thank)
ASKER
gheist:
Like we said in a previous entry, we could't find the download of Percona. Can you provide a direct download link to the Percona site where the download for our Windows environment?
Thanx
Like we said in a previous entry, we could't find the download of Percona. Can you provide a direct download link to the Percona site where the download for our Windows environment?
Thanx
https://www.percona.com/downloads/percona-toolkit/
the last tar.gz file
the last tar.gz file
ASKER
Download the tag.gz file but there is no install program so we assume that we have to copy it to Program Files.
Also downloaded the Percona Toolkit manual and also there is no install instruction only this:
As you can see, there is no mention of install for windows but same info we sent on ID: 40826847. So we just extracted the contents and placed it under the "Program Files" folder.
What's next?
Also downloaded the Percona Toolkit manual and also there is no install instruction only this:
As you can see, there is no mention of install for windows but same info we sent on ID: 40826847. So we just extracted the contents and placed it under the "Program Files" folder.
What's next?
you just unzip in any directory and run scrpts from cmd
bash and perl should be in path.
bash and perl should be in path.
ASKER
Ok, what script? Cam you indicate the folder under Percona that we have find those scripts?
Afterward, in cmd what command exactly should we run?
Afterward, in cmd what command exactly should we run?
ASKER
(we know all this is simple for you, for us is toatrly new... Greatly appreciate if you take that in consideration when answering)
INSTALL file in top level in archive explains installation procedure.
PS i dont have access to windows and have not used it for years.
PS i dont have access to windows and have not used it for years.
ASKER
Unfortunately there is no file with instruction; maybe for Windows environment there some differences. Listen, don't worry about, you've done what you can. We'll continue on with this. Thanx for all your help.
good luck.
ASKER CERTIFIED SOLUTION
membership
This solution is only available to members.
To access this solution, you must be a member of Experts Exchange.
ASKER
Thank you very much!!! Worked like a charm!!!
(now we are reviewing the log).
Will proceed close question.
(now we are reviewing the log).
Will proceed close question.
ASKER
I've requested that this question be closed as follows:
Accepted answer: 0 points for rayluvs's comment #a40831324
for the following reason:
Thanx!
Accepted answer: 0 points for rayluvs's comment #a40831324
for the following reason:
Thanx!
Indeed for thanks you accept other's comment or explain how you took path that is completely different from what others took. Namely http:#a40829407 got your thanks, while http:#a40778545 mentioned same without config example.
Great to hear it's all working now, although I think something went a bit wrong with the answer accepting process :)
Anyway - gheist should definitely also gets some points here too - he gave you a lot of help as well.
Although now you may need some help with Expert's Exchange system for accepting an answer - the admins can probably assist with that.
Doug
Anyway - gheist should definitely also gets some points here too - he gave you a lot of help as well.
Although now you may need some help with Expert's Exchange system for accepting an answer - the admins can probably assist with that.
Doug
ASKER
(sorry about the accepting the wrong entry, since EE change the way of closing the question, we have done this like 3 times)
Hi gheist, in reply of your comment: we gave thanx to dpearson because he cleared our doubts and in also gave us a direct example of "slow query". Last week based on one of dpearson entries, we modify our searches regarding "slow query" and found various helpful links that really helped us understand this process of "slow query". Specially one youtube link, https://www.youtube.com/watch?v=4haU7uAcRjs, that summarize the solution as follow:
When we checked back on our question, we seen dpearson response. And even though it confirmed we were in the right track, it was a more complete solution than the video.
As said initially, we are totally new to MySQL. Even though initially, you stated that Experts Exchange does not finds answers for us and clearing for us that in EE almost nobody there is employee of experts exchange, you did assist us. And yes, your entry in ID 40778545 mentions "slow query" and you also mentioned it in the entries ID 40779823 and ID 40825742. Unfortunately, was not helpful. Prior placing the question we went thru MySQL forums, specially dev.mysql.com but was somewhat difficult to grasp. In addition, we went thru your recommendations of Percona Toolkit, installing linux in vmware player, PER, ActiveState, bash, etc. We installed them, worked with them, found problems with them on windows and looked up info on them to properly understand them and resolve the problems; unfortunately, no success. In one entry you recommended workbench and we replied we already have it and asked where to find the trace-like or profile-like feature in workbench; but no answer. Until you mentioned your don't know much of Windows, we understood why it was difficult to grasp your assistance.
Nevertheless, you took the time to assist and genuinely tried to help us. So as dpearson suggest, you should receive points.
Again EE thanx for all your help!
Hi gheist, in reply of your comment: we gave thanx to dpearson because he cleared our doubts and in also gave us a direct example of "slow query". Last week based on one of dpearson entries, we modify our searches regarding "slow query" and found various helpful links that really helped us understand this process of "slow query". Specially one youtube link, https://www.youtube.com/watch?v=4haU7uAcRjs, that summarize the solution as follow:
Open my.ini
add line "log=file_log.log"
restart services
Done.
When we checked back on our question, we seen dpearson response. And even though it confirmed we were in the right track, it was a more complete solution than the video.
As said initially, we are totally new to MySQL. Even though initially, you stated that Experts Exchange does not finds answers for us and clearing for us that in EE almost nobody there is employee of experts exchange, you did assist us. And yes, your entry in ID 40778545 mentions "slow query" and you also mentioned it in the entries ID 40779823 and ID 40825742. Unfortunately, was not helpful. Prior placing the question we went thru MySQL forums, specially dev.mysql.com but was somewhat difficult to grasp. In addition, we went thru your recommendations of Percona Toolkit, installing linux in vmware player, PER, ActiveState, bash, etc. We installed them, worked with them, found problems with them on windows and looked up info on them to properly understand them and resolve the problems; unfortunately, no success. In one entry you recommended workbench and we replied we already have it and asked where to find the trace-like or profile-like feature in workbench; but no answer. Until you mentioned your don't know much of Windows, we understood why it was difficult to grasp your assistance.
Nevertheless, you took the time to assist and genuinely tried to help us. So as dpearson suggest, you should receive points.
Again EE thanx for all your help!
ASKER
Thanx
Thank you too.
ASKER