pjfromny
asked on
Need pivot table to summarize multiple tables
I have several sets of data organized into tables. Each table contains the same headings. The tables contain detail about projects related to facilities, and I need to use a pivot table to summarize the data. I need to end up with a pivot table where the rows are building names and the columns are years, and the values are sums of all of the projects for that building in that year. I've used the pivot table wizard and the multiple consolidation ranges, but I don't end up with the columns in my original tables as choices for my pivot table.
what version of Excel do you have>?
ASKER
Office 365
well, then very easy way.
Use the Data Model to create a new PivotTable
Click any cell on the worksheet.
Click Insert > PivotTable.
PivotTable button on the Insert tab
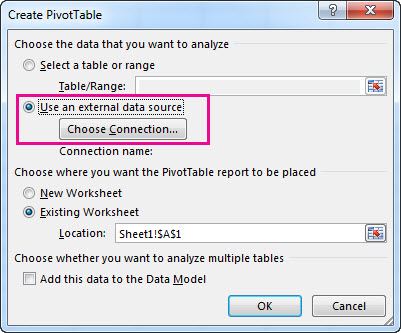
In the Create PivotTable dialog box, under Choose the data that you want to analyze, click Use an external data source.
Create PivotTable dialog box with Use an external data source selected
Click Choose Connection.
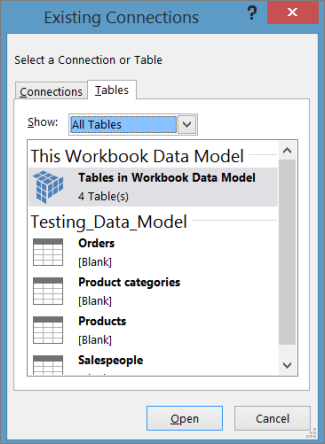
On the Tables tab, in This Workbook Data Model, select Tables in Workbook Data Model.
Tables in the Data Model
Click Open, and then click OK to show a Field List containing all the tables in the Data Model.
Use the Data Model to create a new PivotTable
Click any cell on the worksheet.
Click Insert > PivotTable.
PivotTable button on the Insert tab
In the Create PivotTable dialog box, under Choose the data that you want to analyze, click Use an external data source.
Create PivotTable dialog box with Use an external data source selected
Click Choose Connection.
On the Tables tab, in This Workbook Data Model, select Tables in Workbook Data Model.
Tables in the Data Model
Click Open, and then click OK to show a Field List containing all the tables in the Data Model.
also another way, using this video tutorial that shows how to do it without use of external link as i mentioned above.
with this you simply add it to the data module
with this you simply add it to the data module
ASKER
I don't see the screen as in the last graphic. When I choose "tables," I see the following:
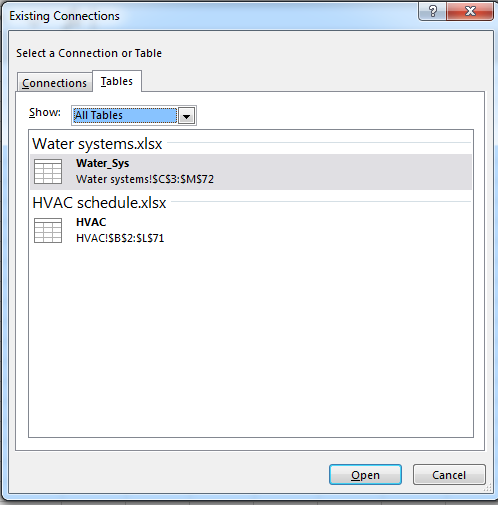
Those are two files that I have open, though the tables with contain the data are not specified, just the range the table covers. I can choose one but not both. I don't see anything that looks like "4 Tables in workbook table model."
The tables are in separate excel files.
Those are two files that I have open, though the tables with contain the data are not specified, just the range the table covers. I can choose one but not both. I don't see anything that looks like "4 Tables in workbook table model."
The tables are in separate excel files.
ASKER CERTIFIED SOLUTION
membership
This solution is only available to members.
To access this solution, you must be a member of Experts Exchange.
ASKER
It worked! A few followup questions:
- it seems to only work with csv files; is that true? I tried with .xlsx files but it returned an error.
- if additional data is added, is that brought into the aggregated file if the query is refreshed?
-is it possible to add new files to the query?
Thank you.
- it seems to only work with csv files; is that true? I tried with .xlsx files but it returned an error.
- if additional data is added, is that brought into the aggregated file if the query is refreshed?
-is it possible to add new files to the query?
Thank you.
What option did you use? Power query or vba?
What is the error number or description?
If you used the vba option then I can change the code that can work in xlsx files.
With simple refresh of pivot table the additional data cannot be aggregated then vba need to run to do that.
What is the error number or description?
If you used the vba option then I can change the code that can work in xlsx files.
With simple refresh of pivot table the additional data cannot be aggregated then vba need to run to do that.
This question has been classified as abandoned and is closed as part of the Cleanup Program. See the recommendation for more details.