marrowyung
asked on
SP_who2 and sys.dm_os_waiting_tasks
Dear all,
right now comparing and also found out the diff between the result between SP_who2 and sys.dm_os_waiting_tasks , now the sp_who2 return no blocking but sys.dm_os_waiting_tasks,
my sys.dm_os_waiting_tasks return 2 x blocking session by a process, the sys.dm_os_waiting_tasks's blocking session is the same as the blockby column returned by Sp_who2, right? which means which other resource the query is waiting for, right ?
what if the session_id and blocking session is about the same spid ? what is that mean ?
how to make result from sys.dm_os_waiting_tasks is the same as sp_who2 ?
please share on how you guy use sys.dm_os_waiting_tasks ! or other view can replay sp_who2 totally !
What is the wait_type for the process blocking itself?
The source view for sp_who2 is sys.sysprocesses. You may query it directly.
The SPID should be equal in both views but how do you ensure both views are queried at the same time?
You may read more about column meaning in the sys.dm_os_waiting_tasks here and here.
You may read more about sys.sysprocesses here and here.
ASKER
pcelba,
"The source view for sp_who2 is sys.sysprocesses. You may query it directly."
I usually use sys.sysprocess, but that one don't show you which one is the blocking head, right?
"The SPID should be equal in both views but how do you ensure both views are queried at the same time?"
by running as a batch but result just return one by one by just fast enough?
SOLUTION
membership
This solution is only available to members.
To access this solution, you must be a member of Experts Exchange.
ASKER
what I am worrying about here is I run the query :
it returns sth like the result.
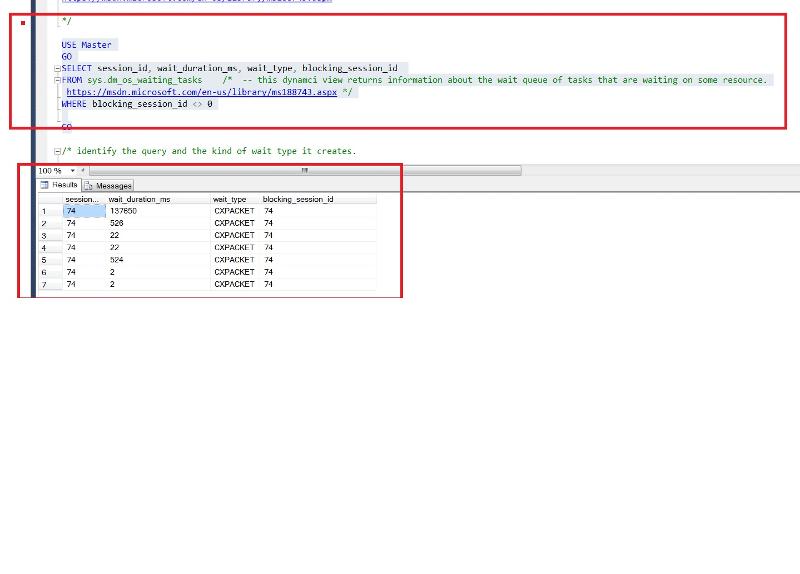
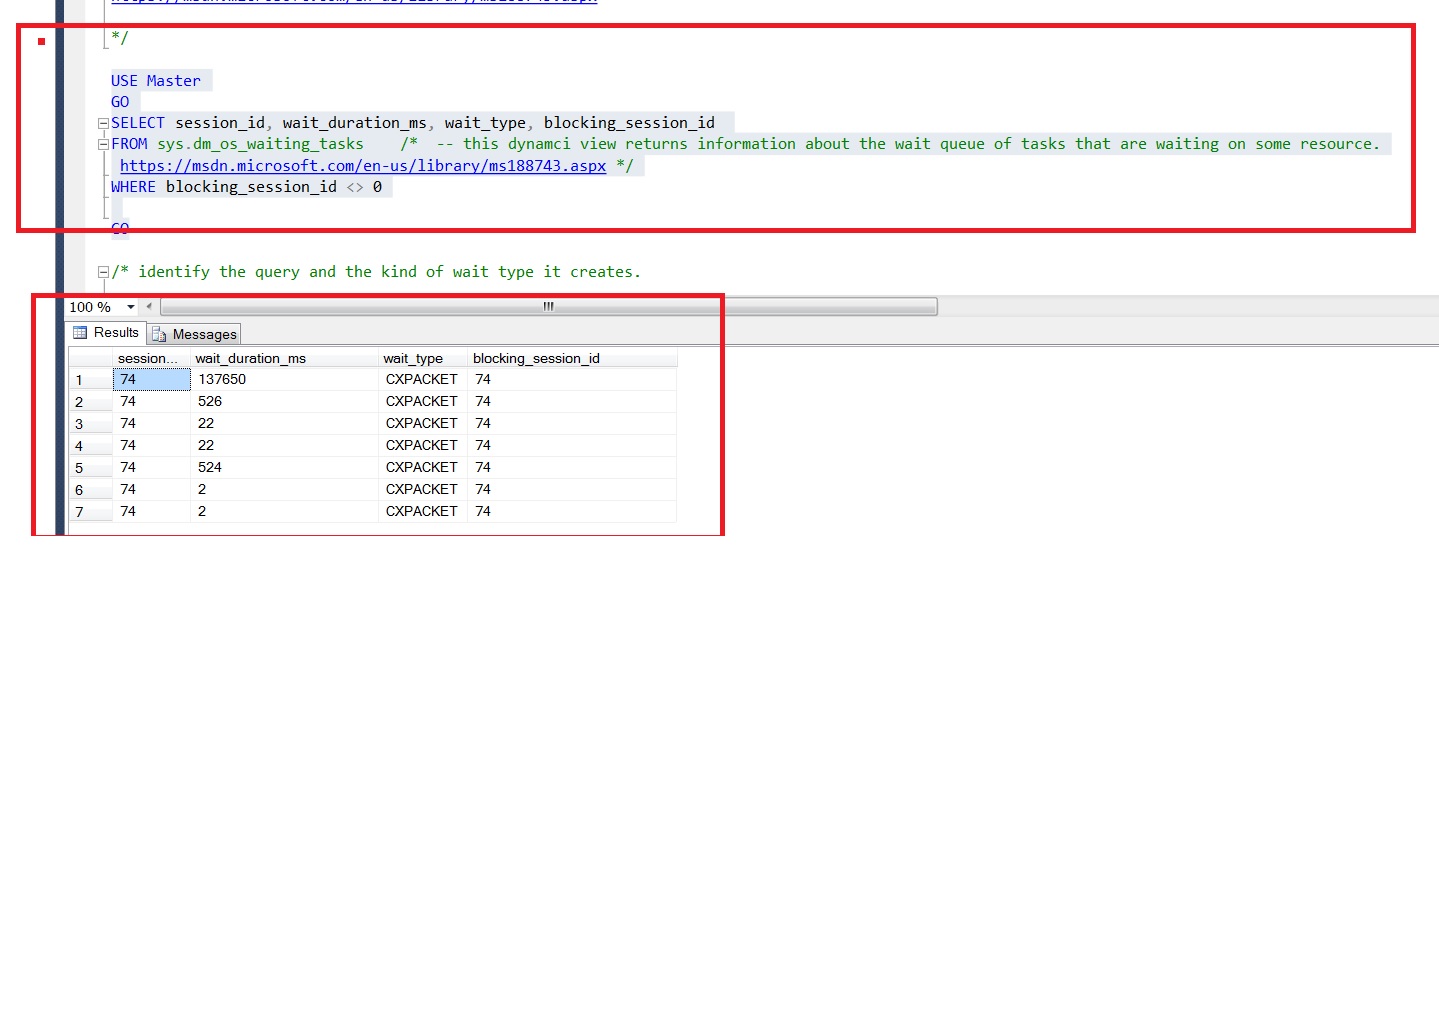
why session_id and blocking_session_id is the same ?
so this result means session_id is waiting to execute and nothing block that? (sp_who2 show nothing as the blocking chain head !), and it execute using parallelism method ?
it returns sth like the result.
why session_id and blocking_session_id is the same ?
so this result means session_id is waiting to execute and nothing block that? (sp_who2 show nothing as the blocking chain head !), and it execute using parallelism method ?
ASKER
this query also shows me same result:
SELECT dm_ws.wait_duration_ms,
dm_ws.wait_type,
dm_es.status,
dm_t.TEXT,
dm_qp.query_plan,
dm_ws.session_ID,
dm_es.cpu_time,
dm_es.memory_usage,
dm_es.logical_reads,
dm_es.total_elapsed_time,
dm_es.program_name,
DB_NAME(dm_r.database_id) DatabaseName,
-- Optional columns
dm_ws.blocking_session_id,
dm_r.wait_resource,
dm_es.login_name,
dm_r.command,
dm_r.last_wait_type
FROM sys.dm_os_waiting_tasks dm_ws
INNER JOIN sys.dm_exec_requests dm_r ON dm_ws.session_id = dm_r.session_id
INNER JOIN sys.dm_exec_sessions dm_es ON dm_es.session_id = dm_r.session_id
CROSS APPLY sys.dm_exec_sql_text (dm_r.sql_handle) dm_t
CROSS APPLY sys.dm_exec_query_plan (dm_r.plan_handle) dm_qp
WHERE dm_es.is_user_process = 1
GO
Great! We are closer... The CXPACKET wait type is caused by internal parallelism and the process can "wait for itself". This article will give you better picture.
The process doesn't wait for itself. It is waiting, however, to finish, like any other process, parallel or not. Any process takes some time to finish, when executes in parallel then the work is divided between threads, which will not get the same amount of work so some will finish faster, but it is still the same process. And a process will not lock itself.
So the process waits to finish all its threads... in other words it waits for itself :-).
If you put it this way then any process while is executing is waiting to finish, so it's waiting for itself. :)
marrowyung, do you still need help with this question?
ASKER
pcelba and Zberteoc,
so basically this query:
return useless information as we only see a query is running and it don't say how long we have to wait before it is done, right? but what if session_id and blocking session show different id ? possible?
Zberteoc,
"There is a big difference between sp_who2 and sys.dm_os_waiting_tasks. The first one returns ALL the processes, unless you filter them(i.e. EXEC sp_who2 active -- to see only active processes)"
how many other option we have, and it seems active is very enough for troubleshooting ? in case we have to find out what is slow AND/OR who is the blocker ?
so EXEC sp_who2 active = select * from sys.dm_os_waiting_tasks ?
"A process cannot lock itself. The information is always in report to other processes. In a deadlock situation 2 processes block each other or if more than 2 could be a cyclic situation.
"
I am not saying which is locking which, I am concerning which one return most of the information about query blocking information and which query is slow ! so I compare them.
"Personally I am using Adam Machanic's sp_WhoIsActive stored proc. "
I am using that too but it seems that it don't show like sp_who2 on which one is blocking head, right?
I run whoisactive by:
which let me highly focus on which query eat up all tempdB storage, which a big big problem in the past!
if I run this, I see will 2 x information which might help me, the wait_info and blocking_session , what are they both means?
can I make use of who is active to get what sp_who2 and sys.dm_os_waiting_tasks so I just run one query ?
so you mean here is even sp_who2 + the os waiting task is not as good as whoisactive ?
"If you want to run it periodically and catch the results for later analysis you can learn here:
http://www.littlekendra.com/2011/02/01/whoisactive/"
oh you mean store in a table and check it later on ? I am already doing this but stopped as the problem identified ! we knew who/which query take up so many tempdB space.
we are very close now !
"I am using it to save data in a table whenever teh number of waiting processes grows over a threshold value, 150, for instance. I have a job that runs every minute and if the count of waithing processes is >150 I run the sp_WhoIsActive procedure to save the results into a table."
this is good and how you make it? I just run whoisactive during the CPU high period as you know whoisactive will take large amount of CPU time.
so basically this query:
USE Master
GO
SELECT session_id, wait_duration_ms, wait_type, blocking_session_id
FROM sys.dm_os_waiting_tasks
WHERE blocking_session_id <> 0

GOreturn useless information as we only see a query is running and it don't say how long we have to wait before it is done, right? but what if session_id and blocking session show different id ? possible?
Zberteoc,
"There is a big difference between sp_who2 and sys.dm_os_waiting_tasks. The first one returns ALL the processes, unless you filter them(i.e. EXEC sp_who2 active -- to see only active processes)"
how many other option we have, and it seems active is very enough for troubleshooting ? in case we have to find out what is slow AND/OR who is the blocker ?
so EXEC sp_who2 active = select * from sys.dm_os_waiting_tasks ?
"A process cannot lock itself. The information is always in report to other processes. In a deadlock situation 2 processes block each other or if more than 2 could be a cyclic situation.
"
I am not saying which is locking which, I am concerning which one return most of the information about query blocking information and which query is slow ! so I compare them.
"Personally I am using Adam Machanic's sp_WhoIsActive stored proc. "
I am using that too but it seems that it don't show like sp_who2 on which one is blocking head, right?
I run whoisactive by:
 EXEC sp_WhoIsActive
     @show_own_spid = 1,
     @get_plans =1 ,
     @get_additional_info =1,
@get_transaction_info = 1which let me highly focus on which query eat up all tempdB storage, which a big big problem in the past!
if I run this, I see will 2 x information which might help me, the wait_info and blocking_session , what are they both means?
can I make use of who is active to get what sp_who2 and sys.dm_os_waiting_tasks so I just run one query ?
so you mean here is even sp_who2 + the os waiting task is not as good as whoisactive ?
"If you want to run it periodically and catch the results for later analysis you can learn here:
http://www.littlekendra.com/2011/02/01/whoisactive/"
oh you mean store in a table and check it later on ? I am already doing this but stopped as the problem identified ! we knew who/which query take up so many tempdB space.
we are very close now !
"I am using it to save data in a table whenever teh number of waiting processes grows over a threshold value, 150, for instance. I have a job that runs every minute and if the count of waithing processes is >150 I run the sp_WhoIsActive procedure to save the results into a table."
this is good and how you make it? I just run whoisactive during the CPU high period as you know whoisactive will take large amount of CPU time.
ASKER
pcelba,
"The blocking head is difficult to identify sometimes."
of the blocking head is running too fast ?
"The blocking head is difficult to identify sometimes."
of the blocking head is running too fast ?
ASKER
Zberteoc,
"Any process takes some time to finish, when executes in parallel then the work is divided between threads, which will not get the same amount of work so some will finish fast"
so you are talking about parallelism is not going to divide work evenly ?
"Any process takes some time to finish, when executes in parallel then the work is divided between threads, which will not get the same amount of work so some will finish fast"
so you are talking about parallelism is not going to divide work evenly ?
ASKER
hi all,
from here https://msdn.microsoft.com/en-us/library/ms188743(v=sql.105).aspx
blocking_task_address and blocking session is the query still holding the resource and other query has to wait for that session to complete before keep going ?
from here https://msdn.microsoft.com/en-us/library/ms188743(v=sql.105).aspx
blocking_task_address and blocking session is the query still holding the resource and other query has to wait for that session to complete before keep going ?
"of the blocking head is running too fast ?" - No, the meaning was "The blocking head is impossible to identify if you have two or more processes waiting to each other".
"parallelism is not going to divide work evenly ?" Yes, exactly. You never know what tasks and delays are on the way.
"blocking task" is the task/session which blocks the "waiting task". The waiting task waits for free resources which are currently blocked. "Other query" is not relevant term in this context.
SOLUTION
membership
This solution is only available to members.
To access this solution, you must be a member of Experts Exchange.
ASKER CERTIFIED SOLUTION
membership
This solution is only available to members.
To access this solution, you must be a member of Experts Exchange.
One more thing, it is recommendable to add an index on the collection_time column:
CREATE NONCLUSTERED INDEX [NIX_collection_time] ON [dbo].<table_name>
(
	[collection_time] ASC
)ASKER
Zberteoc,
I already got that archive/historical whoisactive working long time ago as the whoisactive also tell people how to do it.
but this one is good:
"You can change the 150 value to whatever fits you and for test to see the results regardless, use 1. Again, change the <table_name>."
tks.
pcelba,
""The blocking head is impossible to identify if you have two or more processes waiting to each other"."
oh, you are talking about dead lock ,right? that one I will turn on SQL profiler and use the deadlock graphic to detect it. it will be very clear !
"You never know what tasks and delays are on the way."
sorry ,can't understand why it is related to parallel execution can't spread data evenly ! I read an article that sometimes user #<table> make the parallel execution can't spread evenly !
""blocking task" is the task/session which blocks the "waiting task""
so blocking task you are talking about is blocking session, which shows the SPID of the query that blocks the waiting task , which is the same as the blkby from sp_who2, right?
but would it be easlier if I run this :
if it is empty, which alreayd means nothing blocked and no query is waiting for others, right?
what can we use this for:
Vitor Montalvão,
I tried to use your query and result is:
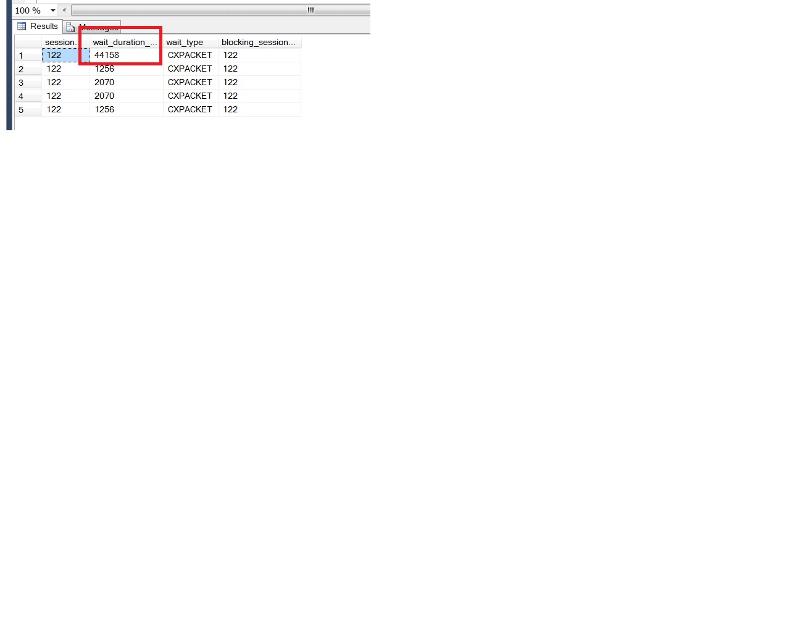
What I don't understand is, where I press F5, the value in the red circle keep increasing, so this query is keep waiting for parallel execution and it don't even start it yet and that's why the value keep increasing ?
"By default MAXDOP is 0, which means to use all available processors. SQL Server engine handles this automatically meaning that the majority of the queries don't use parallelism but only the ones SQL Server chose to, depending on the query cost."
This one very goods and tks, but if it is 0, should we give a hints ?or it will the use the system configured MAXDOP value ?
what if for all query we just keep doing MAXDROP 0 as the hints, then everything should be easlier and no more consideration on the use of parallel execution any more, right?
I already got that archive/historical whoisactive working long time ago as the whoisactive also tell people how to do it.
but this one is good:
"You can change the 150 value to whatever fits you and for test to see the results regardless, use 1. Again, change the <table_name>."
tks.
pcelba,
""The blocking head is impossible to identify if you have two or more processes waiting to each other"."
oh, you are talking about dead lock ,right? that one I will turn on SQL profiler and use the deadlock graphic to detect it. it will be very clear !
"You never know what tasks and delays are on the way."
sorry ,can't understand why it is related to parallel execution can't spread data evenly ! I read an article that sometimes user #<table> make the parallel execution can't spread evenly !
""blocking task" is the task/session which blocks the "waiting task""
so blocking task you are talking about is blocking session, which shows the SPID of the query that blocks the waiting task , which is the same as the blkby from sp_who2, right?
but would it be easlier if I run this :
USE Master
GO
SELECT *
FROM sys.dm_exec_requests
WHERE blocking_session_id <> 0;
GOif it is empty, which alreayd means nothing blocked and no query is waiting for others, right?
what can we use this for:
select * from sys.dm_os_wait_stats where wait_type = 'CXPACKET';Vitor Montalvão,
I tried to use your query and result is:
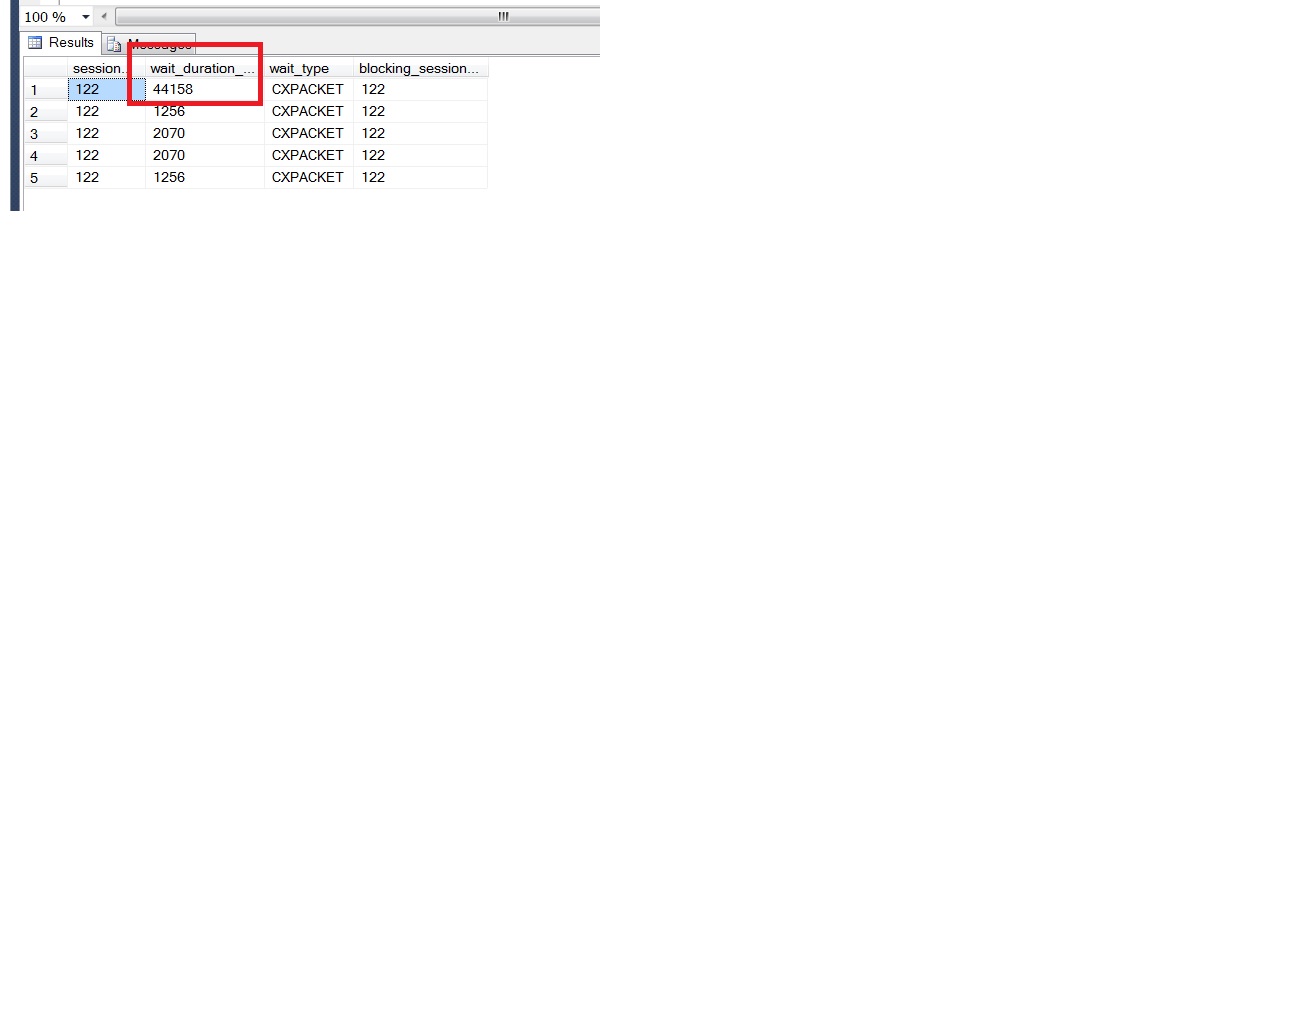
What I don't understand is, where I press F5, the value in the red circle keep increasing, so this query is keep waiting for parallel execution and it don't even start it yet and that's why the value keep increasing ?
"By default MAXDOP is 0, which means to use all available processors. SQL Server engine handles this automatically meaning that the majority of the queries don't use parallelism but only the ones SQL Server chose to, depending on the query cost."
This one very goods and tks, but if it is 0, should we give a hints ?or it will the use the system configured MAXDOP value ?
what if for all query we just keep doing MAXDROP 0 as the hints, then everything should be easlier and no more consideration on the use of parallel execution any more, right?
ASKER
Dear all,
the aim of this post is to let me find the blocking query and the slow query and I hope I can use the minimum number of script to do it.
I usually do in this order:
1) EXEC sp_who2 active; to see if there are number/spid in the blkby column, if a spid keep showing up on the column, then I would like to know what it is !
2) check if there are any blocked SQL query :
3) chekc and see any query is waiting:
from time to time I see only one sessionid here, which is also the spid of the query, right?
4) use this query if I want to dig into detail of the waiting query with XML execution plan:
5) if I know query by specified login causing problme and I would like to check how long it rans I will use:
is it too much ?
Just want to make use of limited number of script to pinpoint out the troublemaking query quickly and consider adding index for it or fix it.
the aim of this post is to let me find the blocking query and the slow query and I hope I can use the minimum number of script to do it.
I usually do in this order:
1) EXEC sp_who2 active; to see if there are number/spid in the blkby column, if a spid keep showing up on the column, then I would like to know what it is !
2) check if there are any blocked SQL query :
USE Master
GO
SELECT *
FROM sys.dm_exec_requests
WHERE blocking_session_id <> 0;
GO3) chekc and see any query is waiting:
USE Master
GO
SELECT session_id, wait_duration_ms, wait_type, blocking_session_id
FROM sys.dm_os_waiting_tasks
WHERE blocking_session_id <> 0
 AND wait_duration_ms > 1000
GOfrom time to time I see only one sessionid here, which is also the spid of the query, right?
4) use this query if I want to dig into detail of the waiting query with XML execution plan:
SELECT dm_ws.wait_duration_ms,
dm_ws.wait_type,
dm_es.status,
dm_t.TEXT,
dm_qp.query_plan,
dm_ws.session_ID,
dm_es.cpu_time,
dm_es.memory_usage,
dm_es.logical_reads,
dm_es.total_elapsed_time,
dm_es.program_name,
DB_NAME(dm_r.database_id) DatabaseName,
-- Optional columns
dm_ws.blocking_session_id,
dm_r.wait_resource,
dm_es.login_name,
dm_r.command,
dm_r.last_wait_type
FROM sys.dm_os_waiting_tasks dm_ws
INNER JOIN sys.dm_exec_requests dm_r ON dm_ws.session_id = dm_r.session_id
INNER JOIN sys.dm_exec_sessions dm_es ON dm_es.session_id = dm_r.session_id
CROSS APPLY sys.dm_exec_sql_text (dm_r.sql_handle) dm_t
CROSS APPLY sys.dm_exec_query_plan (dm_r.plan_handle) dm_qp
WHERE dm_es.is_user_process = 1
GO5) if I know query by specified login causing problme and I would like to check how long it rans I will use:
SELECT spid, waittype as "Type of resource the connection is waiting on", lastwaittype as "Current Type of resource the connection is waiting on of a SPID" ,
 waittime as "the number of milliseconds waiting for that type",
 waitresource as "detailed information about the specific resource that the SPID is waiting on",
 loginame, program_name, hostname as "From host", login_time, last_batch as "last check from us", DB_NAME(dbid) AS "Against database" ,
(SELECT text FROM sys.dm_exec_sql_text(sql_handle))as "Query executed"
FROM master..sysprocesses WHERE loginame= '<SQL login>' and open_tran > 0is it too much ?
Just want to make use of limited number of script to pinpoint out the troublemaking query quickly and consider adding index for it or fix it.
ASKER
one extra question here, under what situation should I use this :
select * from sys.dm_os_wait_stats where wait_type = 'CXPACKET';
ONLY for checking HOW LONG has this TYPE of query has wait to execute, seems not much use, right? any of your case need to use this ?
select * from sys.dm_os_wait_stats where wait_type = 'CXPACKET';
ONLY for checking HOW LONG has this TYPE of query has wait to execute, seems not much use, right? any of your case need to use this ?
With my query you got the blocking session id (122) and now you can get the query tex using this script:
DECLARE @SQLtext VARBINARY(128)

SELECT @SQLtext = sql_handle
FROM sys.sysprocesses
WHERE spid = 122

SELECT TEXT
FROM sys.dm_exec_sql_text(@SQLtext)ASKER
I think the dbcc inputbuffer (spid) can do the same thing too ?
Yes, can do that too.
ASKER
by all my comment, is it possible to do all thing by a single script ? or really go back to who is active ?
pcelba,
"blocking task" is the task/session which blocks the "waiting task".
for query like this:
so the blocking_session_id is the one which CURRENTLY block the session_id which is executing or waiting for execute ?
pcelba,
"blocking task" is the task/session which blocks the "waiting task".
for query like this:
SELECT dm_ws.wait_duration_ms,
dm_ws.wait_type,
dm_es.status,
dm_t.TEXT,
dm_qp.query_plan,
dm_ws.session_ID,
dm_es.cpu_time,
dm_es.memory_usage,
dm_es.logical_reads,
dm_es.total_elapsed_time,
dm_es.program_name,
DB_NAME(dm_r.database_id) DatabaseName,
-- Optional columns
dm_ws.blocking_session_id,
dm_r.wait_resource,
dm_es.login_name,
dm_r.command,
dm_r.last_wait_type
FROM sys.dm_os_waiting_tasks dm_ws
INNER JOIN sys.dm_exec_requests dm_r ON dm_ws.session_id = dm_r.session_id
INNER JOIN sys.dm_exec_sessions dm_es ON dm_es.session_id = dm_r.session_id
CROSS APPLY sys.dm_exec_sql_text (dm_r.sql_handle) dm_t
CROSS APPLY sys.dm_exec_query_plan (dm_r.plan_handle) dm_qp
WHERE dm_es.is_user_process = 1
GOso the blocking_session_id is the one which CURRENTLY block the session_id which is executing or waiting for execute ?
ASKER
please answer my question if you have time .
sp_whoisactive gives you all the information you need, including the blocking session IDs. Of course you can use other scripts if you want or if you are looking for specific things.
When it comes to finding the blocking head you can use a query like this. I am using a table with information saved by the sp_whoisactive (replace YourDatabase and YourTable!):
When it comes to finding the blocking head you can use a query like this. I am using a table with information saved by the sp_whoisactive (replace YourDatabase and YourTable!):
use YourDatabase
go

declare
	@whoisactive_table_name varchar(1000)='YourTable'
declare
	@sql varchar(max)='
;with query as
(
SELECT
	--TOP 100 PERCENT
	 case when wa.[blocking_session_id] is null then ''Yes'' else '''' end as LockHeader
	,wa.[dd hh:mm:ss.mss]
    ,wa.[session_id]
    ,wa.[sql_text]
    ,wa.[login_name]
    ,wa.[wait_info]
    ,wa.[tran_log_writes]
    ,wa.[CPU]
    ,wa.[tempdb_allocations]
    ,wa.[tempdb_current]
    ,wa.[blocking_session_id]
    ,wa.[reads]
    ,wa.[writes]
    ,wa.[physical_reads]
    ,wa.[used_memory]
    ,wa.[status]
    ,wa.[tran_start_time]
    ,wa.[open_tran_count]
    ,wa.[percent_complete]
    ,wa.[host_name]
    ,wa.[database_name]
    ,wa.[program_name]
    ,wa.[start_time]
    ,wa.[login_time]
    ,wa.[request_id]
    ,wa.[collection_time]
	,bl.[session_id_2]
FROM
	[dbo].[<###_table_name_$$$>] wa
	inner join
	(
		SELECT
			 [dd hh:mm:ss.mss]
			,[session_id]
			,[blocking_session_id]
			,coalesce([blocking_session_id],[session_id])  [session_id_2]
		FROM
			[dbo].[<###_table_name_$$$>]
		where
			[blocking_session_id] is not null
			or [session_id] in (select [blocking_session_id] from [dbo].[<###_table_name_$$$>] where [blocking_session_id] is not null)
	) bl
		on bl.[session_id]=wa.[session_id]
)
,Hierarchy
AS
(
    SELECT session_id, sql_text, blocking_session_id, CAST('''' AS VARCHAR(MAX)) as [Path]
        FROM query AS FirtGeneration
        WHERE blocking_session_id IS NULL
    UNION ALL
    SELECT NextGeneration.session_id, NextGeneration.sql_text, Parent.session_id,
    CAST(CASE WHEN Parent.[Path] = ''''
        THEN(CAST(NextGeneration.blocking_session_id AS VARCHAR(MAX)))
        ELSE(Parent.[Path] + ''.'' + CAST(NextGeneration.blocking_session_id AS VARCHAR(MAX)))
    END AS VARCHAR(MAX))
        FROM query AS NextGeneration
        INNER JOIN Hierarchy AS Parent ON NextGeneration.blocking_session_id = Parent.session_id
)
SELECT
	case when blocking_session_id is null then ''Yes'' else '''' end as IsLockHeader,
	session_id,
	sql_text,
	blocking_session_id,
	[Path]
FROM
	Hierarchy
order by
	coalesce(nullif([Path],''''),
	CAST(session_id AS VARCHAR(MAX))),
	blocking_session_id
OPTION(MAXRECURSION 32767)
'
select
	@sql=replace(@sql,'<###_table_name_$$$>',@whoisactive_table_name)
exec (@sql)	/*
select @sql --*/ASKER
Zberteoc,
"sp_whoisactive gives you all the information you need, including the blocking session IDs. Of course you can use other scripts if you want or if you are looking for specific things. "
so from your point of view, one whoisactive is enough ? so most of script I use including sp_who2 active is unnecessary ?
so from whoisactive, I ran in this way:
the blocking_session_id is the one which blocks the session_id of that row returns if any, right?
so session _id and blocking_session_id will never be the same except the query with that session_id is waiting for itself to finish, right ?
"sp_whoisactive gives you all the information you need, including the blocking session IDs. Of course you can use other scripts if you want or if you are looking for specific things. "
so from your point of view, one whoisactive is enough ? so most of script I use including sp_who2 active is unnecessary ?
so from whoisactive, I ran in this way:
   EXEC sp_WhoIsActive
     @show_own_spid = 1,
     @get_plans =1 ,
     @get_additional_info =1,
@get_transaction_info = 1the blocking_session_id is the one which blocks the session_id of that row returns if any, right?
so session _id and blocking_session_id will never be the same except the query with that session_id is waiting for itself to finish, right ?
Since I came across sp_whoisactive I never looked back. I am not using sp_who2 anymoare, which it doesn't give you the exact query that is executed in a process if it is inside a procedure not to mention the execution plan and waiting information. You woul dhave to du DBCC INPUTBUFFER but even that doesn't give you the exact query.
I set up the waiting task monitoring job and I keep all the data to go back whenever I need it.
I also recommend you to use the free tool from Idera called SQL Check. It will show you in a very neat graphic way what is going on on your server. It doesn't keep any history but still is a great tool especially when you run something and want to monitor the effect on server. Heavy queries/processes will bloat in big bubbles and red ring means transaction. If is a deadlock the bubble turns completely red. If you hangover the mouse over the bubble will show you process details with the exact query is executed.
ASKER
"Since I came across sp_whoisactive I never looked back. I am not using sp_who2 anymoare, which it doesn't give you the exact query that is executed in a process if it is inside a procedure not to mention the execution plan and waiting information. You woul dhave to du DBCC INPUTBUFFER but even that doesn't give you the exact query."
yes, we are right and I just interested to use it to find out which is the blocker of the whole chain ONLY! nothing more! for detail, whoisactive is one of the good choice !
"I set up the waiting task monitoring job and I keep all the data to go back whenever I need it."
you are talking about the whoisactive historical table for later analysis purpose ?
"I also recommend you to use the free tool from Idera called SQL Check."
it is also good like Quest's spotlight for any database !
that link is wrong however.
Sorry, here is the link:
https://www.idera.com/productssolutions/freetools/sqlcheck
One more thing about sp_whoisactive, I am using it like this:
"you are talking about the whoisactive historical table for later analysis purpose ?"
Yes, you will look into that for the blocking chain but you will have to filter by collection date.
https://www.idera.com/productssolutions/freetools/sqlcheck
One more thing about sp_whoisactive, I am using it like this:
EXEC sp_WhoIsActive
    @get_plans =1 ,
@get_transaction_info = 1"you are talking about the whoisactive historical table for later analysis purpose ?"
Yes, you will look into that for the blocking chain but you will have to filter by collection date.
ASKER
tks.,
"the blocking_session_id is the one which blocks the session_id of that row returns if any, right?"
I think I need the answer of it as this can make me read easy on the whoisactive output.
"and definitely you don't need your own spid. "
basically if I include this: @show_own_spid = 1, what additional column will I get ?
by your whoisactive usage, it seems don't show up what wait type the query is waiting for, right ?so it is the wait_info is about ? any list of different type of wait type ? I want to check if there are potential problem on hardware so the query might wait for hardware resource. We have to find out if there is any disk access problem so that infrastructure guy can start working on it .
SQL server is an IO intensive server and if the wait type is about hardware problem then we can start doing sth on it.
ASKER
Zberteoc,
"sp_whoisactive (replace YourDatabase and YourTable!):"
here YourTable means the table to which whoisactive save information to ?
how about your database is about ?
"sp_whoisactive (replace YourDatabase and YourTable!):"
here YourTable means the table to which whoisactive save information to ?
how about your database is about ?
ASKER
guys;
"the blocking_session_id is the one which blocks the session_id of that row returns if any, right?"
right?
and wait_info by running:
EXEC sp_WhoIsActive
@show_own_spid = 1,
@get_plans =1 ,
@get_additional_info =1,
@get_transaction_info = 1
is the same as the lastwaittype by:
SELECT spid, waittype as "Type of resource the connection is waiting on", lastwaittype as "Current Type of resource the connection is waiting on of a SPID" ,
waittime as "the number of milliseconds waiting for that type",
waitresource as "detailed information about the specific resource that the SPID is waiting on",
loginame, program_name, hostname as "From host", login_time, last_batch as "last check from us", DB_NAME(dbid) AS "Against database" ,
(SELECT text FROM sys.dm_exec_sql_text(sql_h
FROM master..sysprocesses WHERE open_tran > 0
?
Answering you questions. In my code I used "wildcards" for database and table names that you will have to replace according to your environment. The database should be the same where the sp_whoisactive is residing and the table would be the one where you will save the procedure results to.
Regarding the last query you posted, yes, it would be the same waiting time but you can check by testing to be sure. I created a view myself that should return results similar to sp_whoisactive but I trust more the procedure as it goes deep into SQL server guts but it is still fast. Here is the view:
Regarding the last query you posted, yes, it would be the same waiting time but you can check by testing to be sure. I created a view myself that should return results similar to sp_whoisactive but I trust more the procedure as it goes deep into SQL server guts but it is still fast. Here is the view:
CREATE view [dbo].[vwWhoIsActive]
as
SELECT
	HMSm,
	start_time,
	[db_name],
	session_id,
	command,
	sql_parent,
	sql_statement,
	wait_type,
	wait_time,
	wait_resource,
	[status],
	cpu_time,
	total_elapsed_time,
	blocking_session_id,
	[program_name],
	hostname,
	loginame,
	query_plan

FROM
	(
		SELECT
			right(convert(varchar,
					dateadd(ms, datediff(ms, case when P.last_batch<dte.colletion_time then P.last_batch else dte.colletion_time end, dte.colletion_time), '1900-01-01'),
					121), 12) as HMSm
			,DB_NAME(req.database_id) as [db_name],
			req.start_time,
			dte.colletion_time,
			req.session_id,
			req.command,

			cast(detail.TEXT as nvarchar(max)) as sql_parent,
			cast(SUBSTRING(detail.text,
    				COALESCE(NULLIF((stmt_start / 2)+1, 0), 1),
    				CASE
						case stmt_end when -1 then -1 else stmt_end / 2 end
    						WHEN -1
    							THEN DATALENGTH(detail.text)
    					ELSE
    						(case stmt_end when -1 then -1 else stmt_end / 2 end - (stmt_start / 2))
    					END
    			) as nvarchar(max)) as sql_statement,

			req.wait_type,
			req.wait_time,
			req.wait_resource,
			req.[status],
			req.cpu_time,
			req.total_elapsed_time,
			req.blocking_session_id,
			P.[program_name],
			P.hostname,
			P.loginame,
			pl.query_plan
		FROM
			master.dbo.sysprocesses P
			left join sys.dm_exec_requests req ON P.spid=req.session_id
			left JOIN sys.dm_exec_sessions s ON req.session_id = s.session_id
			CROSS APPLY sys.dm_exec_sql_text (req.sql_handle) detail
			CROSS APPLY sys.dm_exec_query_plan(req.plan_handle) pl
			CROSS APPLY (select getdate() as colletion_time) dte
		where
			p.spid<>@@SPID
			and p.spid>50
			and ecid=0
	) q
GOASKER
"Answering you questions. In my code I used "wildcards" for database and table names that you will have to replace according to your environment. The database should be the same where the sp_whoisactive is residing and the table would be the one where you will save the procedure results to."
oh yeah, so the database name is what making sure sp_whoisactive SP can be found ?
basically in order to make me take away sp_who2, I really want to know exactly if blocking_Session_id is the one which blocks the session_id query and session_id query has to wait for the blocking_Session_id to complete before it can start, right?
but I believe so, because... what else ? and if blocking_session_id and the session_id is the same, then the query is waiting on its own..
"yes, it would be the same waiting time but you can check by testing to be sure."
which my question you are referring to ? sorry I can't understand that. I did ask about waiting type, blocking_session_id and the session_id.
"I created a view myself that should return results similar to sp_whoisactive but I trust more the procedure as it goes deep into SQL server guts but it is still fast. Here is the view:"
then why you have to build a view for that? if it is not as good as sp_whoisactive ?
"basically in order to make me take away sp_who2, I really want to know exactly if blocking_Session_id is the one which blocks the session_id query and session_id query has to wait for the blocking_Session_id to complete before it can start, right?"
I never encountered a session_id blocking itself. An yes, as the column name states, blocking_session_id prevents the session_id process to run. I already clarified that and even gave you a query to identify the head blocker from the sp_whoisactive table. It seems we come back the teh same issues over and over again.
""yes, it would be the same waiting time but you can check by testing to be sure."
which my question you are referring to ? sorry I can't understand that. I did ask about waiting type, blocking_session_id and the session_id."
If you check my post is very clear: Regarding the last query you posted, yes,..." Just look above at your post. you were asking about the waiting time column in 2 different situation.
"then why you have to build a view for that? if it is not as good as sp_whoisactive ?"
Because, like you, I tried to see if I can do something simpler to give me the same results. I don't think this has anything to do with your original question anyway, which I think it was thoroughly answered already.
ASKER
"I never encountered a session_id blocking itself. An yes, as the column name states, blocking_session_id prevents the session_id process to run. I already clarified that and even gave you a query to identify the head blocker from the sp_whoisactive table. It seems we come back the teh same issues over and over again.
"
I think there are miss understanding, tks for it anyway ! and you really use sp_whoisactive a lot for this..
"Because, like you, I tried to see if I can do something simpler to give me the same results. I don't think this has anything to do with your original question anyway, which I think it was thoroughly answered already."
ok, just make me easy to understand. tks.
"which my question you are referring to ? sorry I can't understand that. I did ask about waiting type, blocking_session_id and the session_id."
If you check my post is very clear: Regarding the last query you posted, yes,..." Just look above at your post. you were asking about the waiting time column in 2 different situation.
"
tks anyway. what I mean here is if the wait time returned by:
EXEC sp_WhoIsActive
@show_own_spid = 1,
@get_plans =1 ,
@get_additional_info =1,
@get_transaction_info = 1
is the same waiting time returned by the query I used a lot:
and you are saying yes, right?
Ok, did you try to use Whoisactive to find out the wait types of a query ? like what kind of waiting the query is wait? IO related or what ?
is there a list of wait type check list make my understand all those wait type ?
"
I think there are miss understanding, tks for it anyway ! and you really use sp_whoisactive a lot for this..
"Because, like you, I tried to see if I can do something simpler to give me the same results. I don't think this has anything to do with your original question anyway, which I think it was thoroughly answered already."
ok, just make me easy to understand. tks.
"which my question you are referring to ? sorry I can't understand that. I did ask about waiting type, blocking_session_id and the session_id."
If you check my post is very clear: Regarding the last query you posted, yes,..." Just look above at your post. you were asking about the waiting time column in 2 different situation.
"
tks anyway. what I mean here is if the wait time returned by:
EXEC sp_WhoIsActive
@show_own_spid = 1,
@get_plans =1 ,
@get_additional_info =1,
@get_transaction_info = 1
is the same waiting time returned by the query I used a lot:
SELECT spid, waittype as "Type of resource the connection is waiting on", lastwaittype as "Current Type of resource the connection is waiting on of a SPID" ,
 waittime as "the number of milliseconds waiting for that type",
 waitresource as "detailed information about the specific resource that the SPID is waiting on",
 loginame, program_name, hostname as "From host", login_time, last_batch as "last check from us", DB_NAME(dbid) AS "Against database" ,
(SELECT text FROM sys.dm_exec_sql_text(sql_handle))as "Query executed"
FROM master..sysprocesses WHERE open_tran > 0and you are saying yes, right?
Ok, did you try to use Whoisactive to find out the wait types of a query ? like what kind of waiting the query is wait? IO related or what ?
is there a list of wait type check list make my understand all those wait type ?
ASKER
excellent, you are excellent !
http://logicalread.solarwinds.com/common-sql-server-wait-types/#.Vd04Sfmqp8l
so after reading all those, this means:
1) if the waitype is DTC, it is waiting for transactions distributed in all machine to complete before it actually/total complete, so the only wait to solve it is to wait ?
2) I don't understand this, PAGEIOLATCH_EX, please explain what it means
3) so nothing can b done for this wait type: SOS_SCHEDULER_YIELD ? CPU hight usage means need to buy new CPU ?
4) WRITELOG, so this one keep waiting can mean disk problem as it can't find the log disk to write to or STILL writing which is quite impossible ?
5) no wait type for indicate any RAM problem ?
ASKER
"4) WRITELOG, so this one keep waiting can mean disk problem as it can't find the log disk to write to or STILL writing which is quite impossible ?"
so it is hard to see which SYSTEM DB or user database's log file or which log files having problem ...
so it seems for phsical IO related problem, only the following is needed:
1) LOGBUFFER
2) WRITELOG
?
as by whoisactive or whatever, I ALSO want to pinpoint any potential hardware/disk problem.
I read this: http://blogs.msdn.com/b/psssql/archive/2009/11/03/the-sql-server-wait-type-repository.aspx
also those for SQL server 2005/2008 but not 2012/2014, wait type no diff ?
from here: http://www.sqlskills.com/blogs/paul/worrying-wait-type/
"I’d be unsurprised to see ASYNC_NETWORK_IO, CXPACKET, PAGEIOLATCH_SH, or WRITELOG as the top wait, and I’d be intrigued to see SOS_SCHEDULER_YIELD as the top wait as that’s very uncommon. None of these would be the most worrying IMHO. PAGELATCH_EX would mean there’s a big bottleneck somewhere, which may be easy to alleviate (if in tempdb) or not, but queries would still be progressing."
So is it also the same wait type you all might worry too ? usually what should be worry about ? I worry about disk IO problem.
now some logical table access lock waittype:
1) LCK_M_IX:
2)LCK_M_X:
do they means some one type the table lock without releasing it ? very important to catch something developer done wrong.... :):)):)
if seeing this LCK_M_IX, by a spid, the query of that spid is waiting for a lock release by another spid show by the blocking_session_id, and we can read the SQL text of that blocking_Session_id and start to tune it or/and ask developer why that blocking_Session_id query ran so long?
so the author of that link seems very worry about LCK_M_IX, how about you all ?
ASKER
FYI, how to use whoisactive to find blocker:
http://sqlblog.com/blogs/adam_machanic/archive/2011/04/23/leader-of-the-block-a-month-of-activity-monitoring-part-23-of-30.aspx
http://sqlblog.com/blogs/adam_machanic/archive/2011/04/23/leader-of-the-block-a-month-of-activity-monitoring-part-23-of-30.aspx
@marrowyung
No offense but you are turning this question into a waiting types course one on one, which is way beyond EE purpose. I think this questions has been long answered and is due a reward. You have all you need to read about waiting types and learn more by yourself. It is clear that sp_whoisactive is the way to go.
Good luck to you.
ASKER
but the whole point is learn sth here and wait type is one of these what that sp_who2 give, sorry ! should I open another question for wait type only ?
ASKER
I created a new ticket!
https://www.experts-exchange.com/questions/28709044/the-waittype-in-SP-who2-and-whoisactive.html
https://www.experts-exchange.com/questions/28709044/the-waittype-in-SP-who2-and-whoisactive.html
Another issue is that even if you execute them within the same script/scope the processes change so fast that within milliseconds they will be different. If you want to compare you will have to create yourself a lock situation and then check the results.
A process cannot lock itself. The information is always in report to other processes. In a deadlock situation 2 processes block each other or if more than 2 could be a cyclic situation.
Personally I am using Adam Machanic's sp_WhoIsActive stored proc. This will return what is active at the moment of execution with all kind of useful information including what is the exact query/code that is executed, wait types and times, blocking processes, duration, CPU time, reads and writes time, even the execution plan, which you will not get from neither sp_who2 or sys.dm_os_waiting_tasks. Here is a video about it:
http://www.brentozar.com/archive/2010/09/sql-server-dba-scripts-how-to-find-slow-sql-server-queries/
If you want to run it periodically and catch the results for later analysis you can learn here:
http://www.littlekendra.com/2011/02/01/whoisactive/
I am using it to save data in a table whenever teh number of waiting processes grows over a threshold value, 150, for instance. I have a job that runs every minute and if the count of waithing processes is >150 I run the sp_WhoIsActive procedure to save the results into a table.
Here is the query I use to count the waiting tasks:
Open in new window