marrowyung
asked on
user query that make a user query log growth quickly !
Dear all,
right now tried to find out which query make a user database's log growth quickly but not in tempdB ( I can use whoisactive for that purpose), what script/method you will use ?
dbcc opentrans(<user database>) ;
?
right now tried to find out which query make a user database's log growth quickly but not in tempdB ( I can use whoisactive for that purpose), what script/method you will use ?
dbcc opentrans(<user database>) ;
?
SOLUTION
membership
This solution is only available to members.
To access this solution, you must be a member of Experts Exchange.
ASKER
NO.. the query don't even shows the active log size take up by a user queries !
just spid, status, loginname, hostname , blk dbname , cmd and waitype!
I usually run this:
to find out which is in user in MEMORY but not in transaction log.
just spid, status, loginname, hostname , blk dbname , cmd and waitype!
I usually run this:
SELECT spid, waittype as "Type of resource the connection is waiting on", lastwaittype as "Current Type of resource the connection is waiting on of a SPID" ,
 waittime as "the number of milliseconds waiting for that type",
 waitresource as "detailed information about the specific resource that the SPID is waiting on",
 loginame, program_name, hostname as "From host", login_time, last_batch as "last check from us", DB_NAME(dbid) AS "Against database" ,
(SELECT text FROM sys.dm_exec_sql_text(sql_handle))as "Query executed"
FROM master..sysprocesses WHERE open_tran > 0 to find out which is in user in MEMORY but not in transaction log.
ASKER
hi,
what I wan to do is, if the log of a user database is full, I want to find out which query make this happen and why the query can make the log full.
any idea?
what I wan to do is, if the log of a user database is full, I want to find out which query make this happen and why the query can make the log full.
any idea?
right now tried to find out which query make a user database's log growth quickly but not in tempdB ( I can use whoisactive for that purpose), what script/method you will use ?I would prefer to run a trace on it, since any query that you could have will need to be run many times for refresh purpose and don't keep an history of what happened on the database.
Also with a trace you can have the information of how may rows has been affected so you can identify quickly massive operations on data.
ASKER
I am sorry what trace and how to create that?
I think there can be DMVs and script for me to find out the real time active transaction log figure on which query eat up that part.
I think there can be DMVs and script for me to find out the real time active transaction log figure on which query eat up that part.
Until MSSQL 2008R2 you can use MSSQL Profiler to capture activity in an instance.
From MSSQL 2012 and later versions you should use Extended Events since impact less on your databases.
From MSSQL 2012 and later versions you should use Extended Events since impact less on your databases.
ASKER
"From MSSQL 2012 and later versions you should use Extended Events since impact less on your databases."
yeah, heard about that and EV can also help on detecting deadlock
"Until MSSQL 2008R2 you can use MSSQL Profiler to capture activity in an instance."
but when the log was full, it already too late ?
so no way using DMV or command to find out why that query take so much log and still didn't commit ?
yeah, heard about that and EV can also help on detecting deadlock
"Until MSSQL 2008R2 you can use MSSQL Profiler to capture activity in an instance."
but when the log was full, it already too late ?
so no way using DMV or command to find out why that query take so much log and still didn't commit ?
When the log is full the database don't allows any write operation but read only.
so no way using DMV or command to find out why that query take so much log and still didn't commit ?I think there's but can't remember the correct one now.
ASKER
"When the log is full the database don't allows any write operation but read only."
yeah, but if that query still there and for some reason still active, we can't shrink the log as the transaction still consider as active! we have to kill it first before we can shrink the log.
yeah, but if that query still there and for some reason still active, we can't shrink the log as the transaction still consider as active! we have to kill it first before we can shrink the log.
You can always shrink the log but the active transaction will always stay in the transaction log until you commit or rollback them.
With this I want to say that active transactions aren't a shrink log operation's blocker.
With this I want to say that active transactions aren't a shrink log operation's blocker.
ASKER
"You can always shrink the log but the active transaction will always stay in the transaction log until you commit or rollback them."
yeah, so by shrinking the log, the inactive one gone, but I want to know which active query take the transaction log and don't release it, then I can study if the transaction never commit.
yeah, so by shrinking the log, the inactive one gone, but I want to know which active query take the transaction log and don't release it, then I can study if the transaction never commit.
ASKER
but how can this: DBCC SQLPERF(LOGSPACE) find out, the active transaction log of a query on how many space it take of a particular user database ?
You need to see the transactions, so, use the DBCC OPENTRAN as previously suggested.
There is also the dynamic management view sys.dm_tran_active_transac
From those you can get the SPID and through SQL profiler can seek out the SPIDS and the SQL they are running.
Or, could write a query (rather dig it up from prior attempts) that uses the DMV's. Along the lines of : https://sqltune.wordpress.com/2011/07/12/identify-queries-that-consume-a-large-amount-of-log-space-in-sql-server/
Unfortunately there isn't much you can do to retrospectively analyse what happened. For that, you are better off getting a proven Transaction Log Reader (Redgate, ApexSQL, Toad for SQL, and others).
there are a couple of freebies that you could search for. One I have been meaning to try is the codeplex one : http://internalsviewer.codeplex.com/ but cannot say one way or another as to abilities.
Hope that helps a bit. Sounds like you are in a tough space.
Best (probably) is to get some alerts on "sudden" log growth so you have time to investigate the open transactions. Bit old fashioned, but it does work.
ASKER
"Unfortunately there isn't much you can do to retrospectively analyse what happened. For that, you are better off getting a proven Transaction Log Reader (Redgate, ApexSQL, Toad for SQL, and others)."
):):)
excellent, don't tell me you are selling tools, but of course I knew you are not!
So not much a DMV can do you mean...
"Hope that helps a bit. Sounds like you are in a tough space.
"
no...... but third party application after upgrade can gives this shit !
I will just pinpoint it using whoisactive and kill that spid, then shrink it the log.
"Best (probably) is to get some alerts on "sudden" log growth so you have time to investigate the open transactions. Bit old fashioned, but it does work."
you mean by Disk monitoring tools?
SOLUTION
membership
This solution is only available to members.
To access this solution, you must be a member of Experts Exchange.
ASKER
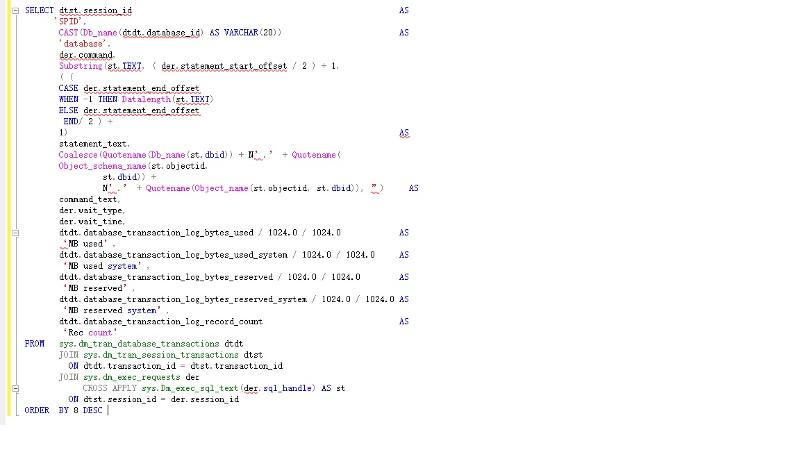
I read this one: https://sqltune.wordpress.com/2011/07/12/identify-queries-that-consume-a-large-amount-of-log-space-in-sql-server/
and the code is:
but when I try to run it, it complains about:
any problem?
and the code is:
——————————————————————————————-
 — Description: T-SQL to find queries that consume a large amount of log space in SQL Server
 — Source: KB # 317375
 — Author: varun.dhawan
 ——————————————————————————————-
 SELECT dtst.session_id                                                       AS
        ‘SPID’,
        CAST(Db_name(dtdt.database_id) AS VARCHAR(20))                        AS
        ‘database’,
        der.command,
        Substring(st.TEXT, ( der.statement_start_offset / 2 ) + 1,
        ( (
        CASE der.statement_end_offset
        WHEN -1 THEN Datalength(st.TEXT)
        ELSE der.statement_end_offset
                                                                       END –
        der.statement_start_offset ) / 2 ) +
        1)                                                                    AS
        statement_text,
        Coalesce(Quotename(Db_name(st.dbid)) + N’.’ + Quotename(
        Object_schema_name(st.objectid,
                 st.dbid)) +
                 N’.’ + Quotename(Object_name(st.objectid, st.dbid)), ”)     AS
        command_text,
        der.wait_type,
        der.wait_time,
        dtdt.database_transaction_log_bytes_used / 1024.0 / 1024.0            AS
        ‘MB used’,
        dtdt.database_transaction_log_bytes_used_system / 1024.0 / 1024.0     AS
        ‘MB used system’,
        dtdt.database_transaction_log_bytes_reserved / 1024.0 / 1024.0        AS
        ‘MB reserved’,
        dtdt.database_transaction_log_bytes_reserved_system / 1024.0 / 1024.0 AS
        ‘MB reserved system’,
        dtdt.database_transaction_log_record_count                            AS
        ‘Rec count’
 FROM   sys.dm_tran_database_transactions dtdt
        JOIN sys.dm_tran_session_transactions dtst
          ON dtdt.transaction_id = dtst.transaction_id
        JOIN sys.dm_exec_requests der
             CROSS APPLY sys.Dm_exec_sql_text(der.sql_handle) AS st
          ON dtst.session_id = der.session_id
ORDER BY 8 DESC but when I try to run it, it complains about:
“Msg 102, Level 15, State 1, Line 22
 Incorrect syntax near ‘–’.
 ”
 which is
 END –
 and SSMS also compliain about:

“Msg 102, Level 15, State 1, Line 23
 Incorrect syntax near ‘der’.
 ”
 any word missing in between :

” ELSE der.statement_end_offset
 END –
der.statement_start_offset ) / 2 ) +”any problem?
Check if the single quotes are the correct character.
And what's your SQL Server version?
And what's your SQL Server version?
ASKER
2014, you can try to do that in your PC, I do it on my local SQL server.
you can parse it without running it and you should see error !
you can parse it without running it and you should see error !
That CROSS APPLY doesn't seem correct to me.
ASKER CERTIFIED SOLUTION
membership
This solution is only available to members.
To access this solution, you must be a member of Experts Exchange.
ASKER
"That CROSS APPLY doesn't seem correct to me. "
I can't see why people on that page keep saying yeah it is working, yeah it is working.
I can't see why people on that page keep saying yeah it is working, yeah it is working.
ASKER
do you know if there is anyway to list the table name too ?
wait.. what have to done to fix the query ?
wait.. what have to done to fix the query ?
The CROSS APPLY had "der." prefix and I think that was wrong.
Also in the CASE statement there was an extra reference to der.statement_end_offset.
Also in the CASE statement there was an extra reference to der.statement_end_offset.
ASKER
when I try it in your way, I still get a lot of red line:
any reason you can see?

any reason you can see?
That's because you need to replace the bad characters with single quotes:
N'.'
'MB ...'
'Rec count'
N'.'
'MB ...'
'Rec count'
Btw, why didn't you copy the code from my comment?
I could see some differences still.
I could see some differences still.
ASKER
"Btw, why didn't you copy the code from my comment?"
nono, just want to try it one by one myself and see why I got it wrong.
"That's because you need to replace the bad characters with single quotes:
N'.'
'MB ...'"
I did it and I see some more change by you:
e.g.
you change "JOIN sys.dm_exec_requests der " to
"JOIN sys.dm_exec_requests AS der "
can't see why we don't need it here:
JOIN sys.dm_tran_session_transa
The 'AS' was only me testing. Is irrelevant.
What's relevant is:
( (CASE der.statement_end_offset
                         WHEN -1 THEN Datalength(st.TEXT)
                         ELSE der.statement_end_offset
                   END) / 2 ) +
         1)  AS   statement_text,
and:
CROSS APPLY sys.Dm_exec_sql_text(sql_h
plus replace the single quotes where are appropriate.
What's relevant is:
( (CASE der.statement_end_offset
WHEN -1 THEN Datalength(st.TEXT)
ELSE der.statement_end_offset
END) / 2 ) +
1) AS statement_text,
and:
CROSS APPLY sys.Dm_exec_sql_text(sql_h
plus replace the single quotes where are appropriate.
ASKER
ok, tks,
ASKER
"The 'AS' was only me testing. Is irrelevant."
"CROSS APPLY sys.Dm_exec_sql_text(sql_h
I am just wondering why this "JOIN sys.dm_tran_session_transa
not important anyway, right?
so just this:
"CROSS APPLY sys.Dm_exec_sql_text(sql_h
I am just wondering why this "JOIN sys.dm_tran_session_transa
not important anyway, right?
so just this:
( (CASE der.statement_end_offset
WHEN -1 THEN Datalength(st.TEXT)
ELSE der.statement_end_offset
END) / 2 ) +
1) AS statement_text,
Yes. The AS keyword it's a more explicity way to define an alias. It can be used for columns and tables but isn't necessary as you can see.
ASKER
you all very good helper.
ASKER
SELECT open_tran FROM master.sys.sysprocesses WHERE SPID=<blocking SPID number>
Go"
I am using both but how can I find out how many active log a query is consuming ?
"*SP_WHO2 command
*Activity Monitor"
I run sp_who2 everyday I don't see it show out what query hold that large amount of active transaction log.
In which the activity monitor show me this, I am watching that and it don't show which query take out so many open/active transaction log.
"A long-running transaction - the log cannot be cleared until the transaction commits or rolls back. You can use DBCC OPENTRAN to show you the oldest active transaction"
yeah, I understand, the problem here is the log of a user database full , 80GB, in few hours ! only today
!
so the query you show above shows the sizes of the ACTIVE part of the user database log sizes and match it with each STILL ACTIVE/BLOCKED user queries ?